Q10 - Pressure and Volume Changes During Breathing
Animal Anatomy and Physiology
The graph below illustrates the pressure and volume changes during breathing.
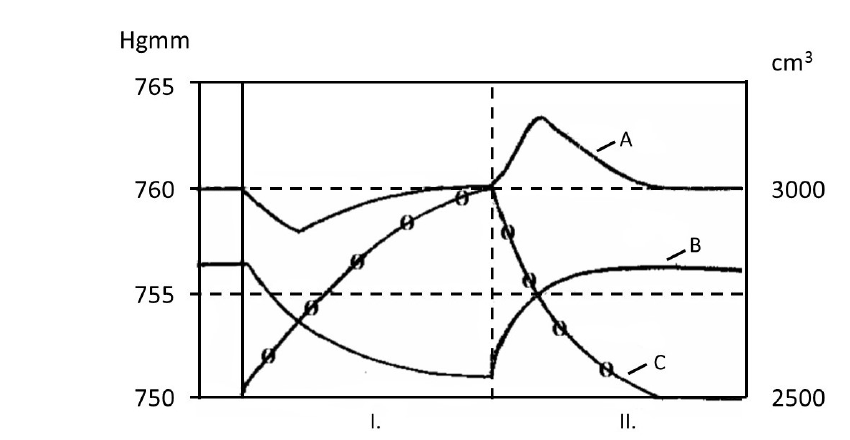 Fig.1.
Identify what is represented by letters A, B and C, and the Roman numerals I. and II. Match these symbols (A–C and I–II) with the descriptions below. Every symbol matches one description only, but there are descriptions that do not match any of those - mark those as “No match”.
Q10.1. The graph shows three curves (A, B, C) and two phases (I, II) during a breathing cycle. Every symbol matches at most one description below; some descriptions match none of the symbols (mark those "no match"). What matches "volume changes of the intrapleural space during breathing"?
Q10.2. What matches "inhalation phase of breathing"?
Q10.3. What matches "pressure change in the lungs (alveolar pressure) during breathing"?
Q10.4. What matches "pressure change in the left ventricle of the heart during breathing"?
Q10.5. What matches "pressure change of the intrapleural space during breathing"?
Q10.6. What matches "volume change of the lung during breathing"?
Q10.7. What matches "exhalation phase of breathing"?
Q10.8. What matches "volume change of the abdominal cavity during breathing"?
Question reproduced from IBO 2019, Theoretical Exam A, licensed under CC BY-NC-SA 4.0 - attributed to the International Biology Olympiad. Open the full exam PDF · Official answer key