BiOBytes
The BiOHorizon Project
Read research the way researchers do
Your textbook stops where the research begins. BiOHorizon Reports pick up from there. Each one takes a single field, finds the most interesting results of the last couple of years, and walks you through what was actually measured, what was only claimed, how sure anyone is, and which part of the biology you are already studying the story rests on.
Why this exists
The gap between the textbook and the lab
A syllabus is a snapshot. Somewhere between the chapter on cellular respiration and the headline about microbes on Mars sits a long chain of measurements, assumptions, arguments and corrections that nobody shows you. News coverage keeps the conclusion and drops the chain. We think the chain is the interesting part, and it is also the part that good Olympiad problems reward: reading a graph, asking what a control would look like, noticing that a result depends on a model.
So each BiOHorizon Report slows down on exactly those steps. You see the instrument, the numbers, the strongest objection, and the arithmetic behind the headline, and then you see which page of your notes explains the mechanism underneath.
What we are trying to do
Four aims
Bridge the textbook and the frontier
Every story ends in "The biology underneath": the mechanism from the notes (respiration, diffusion, chirality, ecology) that makes the headline make sense, with a link to study it properly.
Teach critical reading
Four questions travel through every report. Is the signal real? Is it from where we think? Is there a simpler explanation? Has anyone else got the same result? Once they become a habit, you can use them on any claim.
Show the maths and the computation
Modern biology runs on models, statistics and simulation. Each report works through real arithmetic from published numbers, and some include a simulator where you can watch a statistical fluke appear and fade as more data arrives.
Keep honesty visible
Ratings are explained, sources are numbered, dates are stated, and AI assistance is disclosed. If we could not verify something, the page says so instead of sounding sure.
What is inside
Anatomy of a report
A reading guide
How to judge a claim in this particular field, before any story begins.
An honest scoreboard
A table that states each result's real status in plain words.
4 to 6 research stories
The claim, how they did it, the numbers, where it is contested, the biology underneath.
Worked maths
At least one story shows the calculation, and some add an interactive lab.
What happens next
Dated, sourced milestones, plus a table linking each story to your syllabus.
Glossary and sources
Plain definitions and numbered references to the papers themselves.
How a report is made
From a field to a finished page
Scope
A broad field is narrowed to a real question, such as why most nanomedicines never reach their target. If the question is not sharp, the report is not ready.
Source
We start from the primary papers, prefer open copies, and treat press coverage as context only. Anything we could not read in full is flagged.
Stress-test
For each story we look for the strongest independent rebuttal or reanalysis and read it, so the page can show where the claim is contested.
Compute
We rebuild a key number from published parameters and sanity-check it against the paper's own figures, so the maths is something you can follow, not just trust.
Review and disclose
Reports are drafted with AI assistance and reviewed by a BiOGuide editor before they go live. The assistance is stated on every page and recorded in the project's AI involvement log.
Reading the ratings
Two bars per story
Each story carries two editorial ratings out of five. Data robustness asks how solid the measurement itself is. The second bar changes with the field: in astrobiology it was "bearing on life"; for biomedical topics it will measure how far a result is from patients. These are our judgement calls, not an official scale, and a note beside each bar says why we gave it.
Our promises
How we write
- We keep the sources' hedges. A "potential biosignature" stays potential, and "consistent with" is never upgraded to "proves".
- Every story gets its strongest counter-case, with who raised it and what would settle it.
- Numbers carry units and a source. Derived numbers are checked against the paper.
- We say what we could not verify, and which images or references need a second look.
- Every report states when it was last checked, because this kind of knowledge ages quickly.
- Corrections are welcome and are made in the open.
The reports
Read, and what is next
 Astrobiology
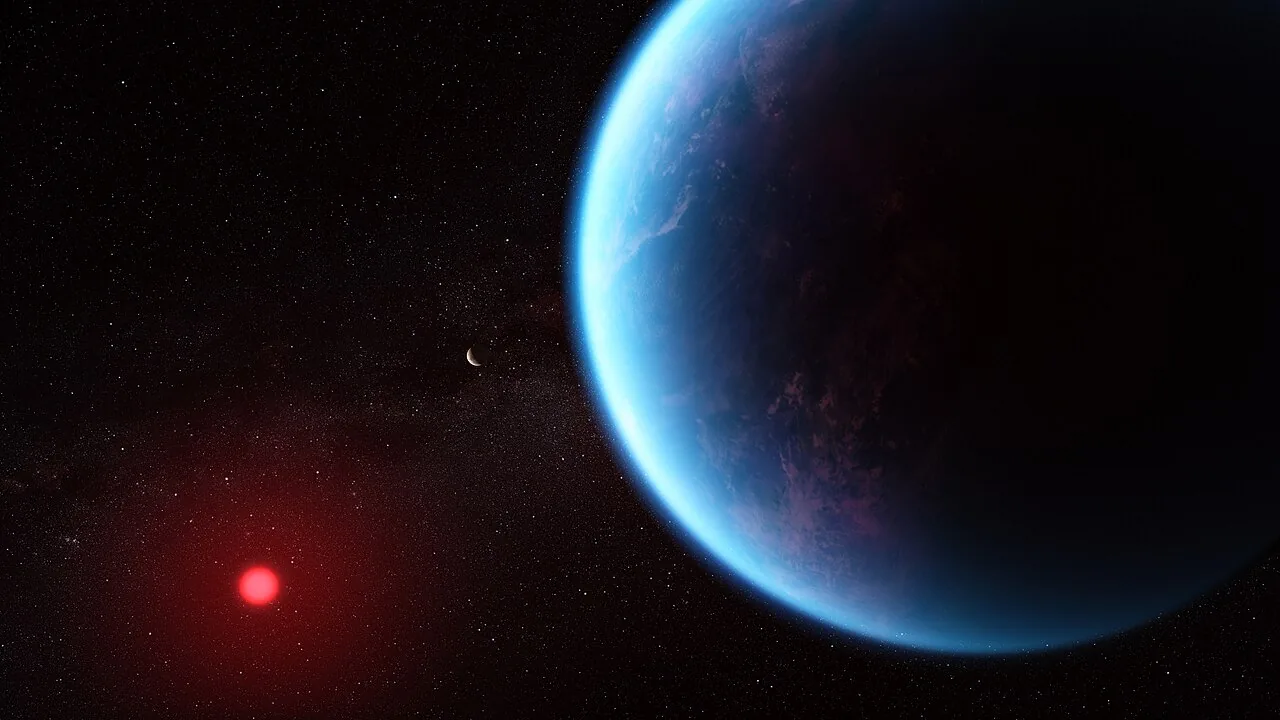
BiOHorizon ReportThe Search for Life, Right NowLeopard spots on Mars, a contested gas on K2-18 b, fresh ocean chemistry from Enceladus, sugar on an asteroid, and a noise lab where you can watch a fluke fade.Cover: illustration by NASA, CSA, ESA, J. Olmsted (STScI); science: N. Madhusudhan (Cambridge). Full credit in the report.Read the report →
 Drug delivery
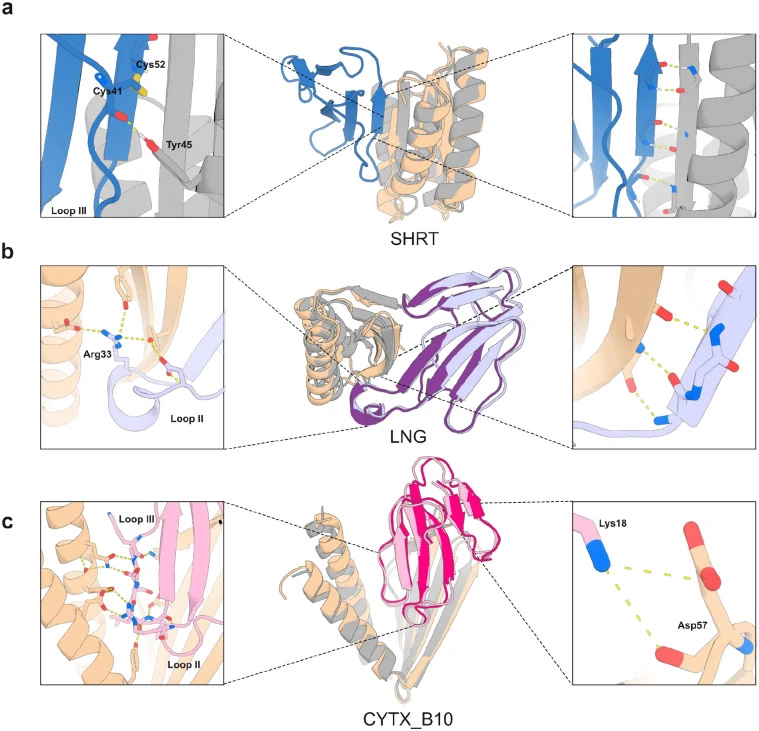
BiOHorizon ReportFrom Screen to BodyAn AI-designed drug in patients, proteins built against snake venom, a gene editor made for one baby, a brain shuttle, and the 2% endosome problem.Cover: figure by Vázquez Torres et al., preprint version of the Nature paper, CC BY 4.0, cropped. Full credit in the report.Read the report →
Your turnWhich field should be next?Tell us a field, a question, or a paper you think deserves a closer look.Suggest a topic →
Browse every report on the BiOHorizon Reports page. Spotted a mistake, or have a paper we should read? Email resourcerepository4boguide@gmail.com.