Q13 - Renal Handling of Glucose
The following graph shows how glucose handling in the kidney changes with plasma concentration.
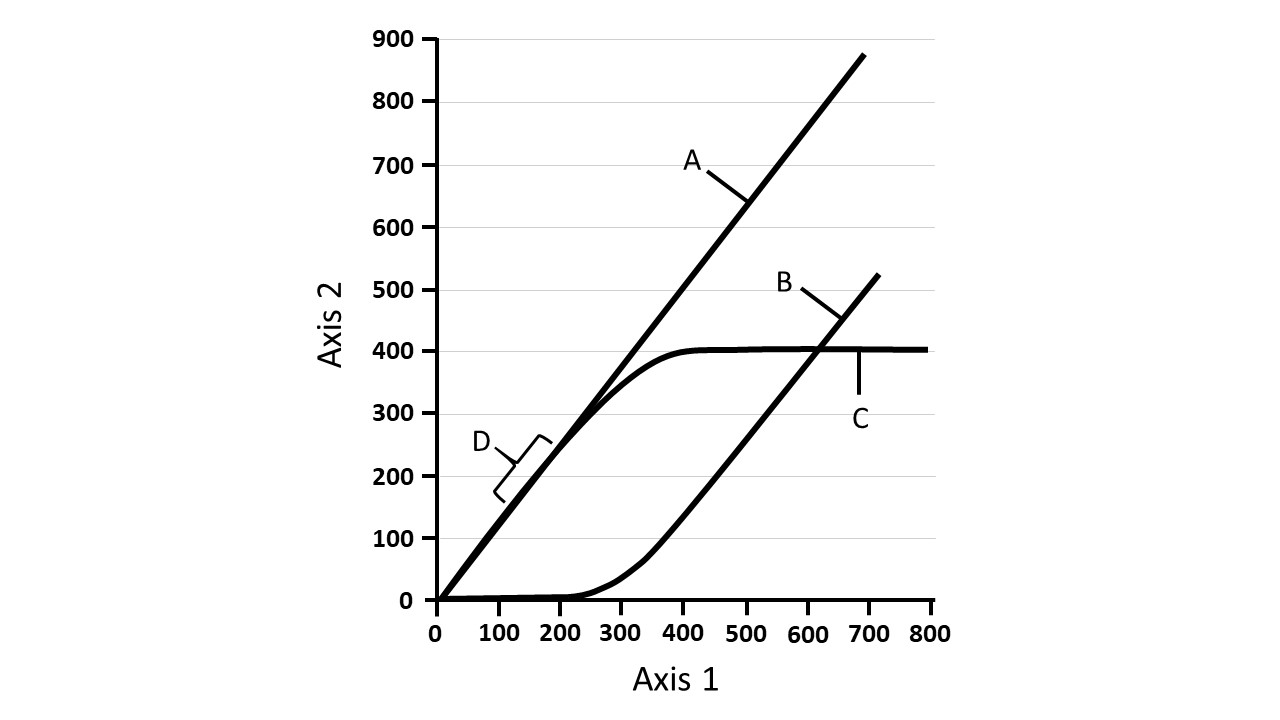 Fig.1. Axis 1 = Plasma glucose concentration (mg/100 ml). Axis 2 = Glucose filtered load, reabsorption or excretion (mg/min).
Match the letters from the figure (A-D) to the correct parameter in the list below.
Q13.1. Glucose is freely filtered in glomeruli.
Q13.2. The graph plots glucose filtered load, reabsorption, and excretion (mg/min) against plasma glucose concentration as curves A-D. Which curve is glucose EXCRETED?
Q13.3. Which curve is glucose FILTERED?
Q13.4. Which curve is glucose REABSORBED?
Q13.5. Which marking indicates "normal levels" (a reference point for normal fasting plasma glucose)?
Q13.6. What is the maximum rate of glucose reuptake (the transport maximum, Tm)? Round to the nearest hundred, in mg/min.
Question reproduced from IBO 2019, Theoretical Exam A, licensed under CC BY-NC-SA 4.0 - attributed to the International Biology Olympiad. Open the full exam PDF · Official answer key