Q24 - Interpreting Pressure-Volume Relationships Across the Cardiac Cycle
Figure 1 represents the changes in aortal (Ao), left atrial (At), and left ventricular (Ve) pressures and the left ventricular volume during a human cardiac cycle. During the cycle, the atrioventricular valve opens when atrial pressure is higher than ventricular pressure, and the aortic valve opens when ventricular pressure is higher than aortic pressure. Figure 2 shows the changes in ventricular pressure and volume before (dotted line) and after (solid line) a ten-minute period of exercise. Figure 3 shows six candidate pressure-volume loop diagrams.
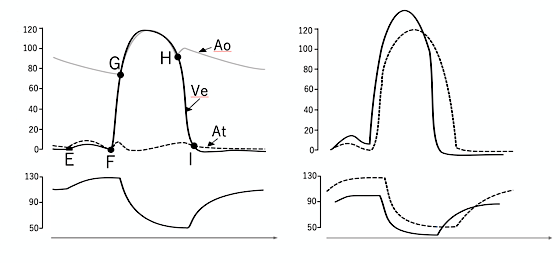 Figure 1.
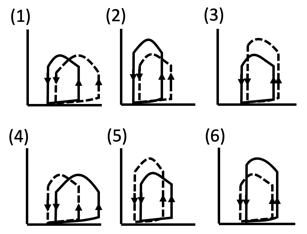 Figure 2.
Using the information and data, determine which of the statements are true or which are false.
Question reproduced from IBO 2020, Theoretical Exam 2, licensed under CC BY-NC-SA 4.0 - attributed to the International Biology Olympiad. Open the full exam PDF · Community solutions (unofficial)