Q25 - Nucleotide Diversity and Selective Sweeps
The average pairwise difference between a pair of sequences in a population is called nucleotide diversity, which is a simple measure of the genetic diversity of a population.
Figure 1 describes 3 alleles (A, B, C) in terms of their frequency in a given population (column 2). Column 3 provides the nucleotide sequences: for alleles B and C only the sequence differences from allele A are provided while positions with the same nucleotide as in A are marked with an asterisk “*”.
 Figure 1. Three alleles with their frequencies and nucleotide sequences.
Nucleotide diversity can be calculated using the formula: pi = sum over all pairs (2 x pi x pj x dij), where pi and pj are frequencies of two alleles, and dij is the difference between them.
Figure 2 plots nucleotide diversity (y-axis) in 300 bp sliding windows along the sequence of gene Y (x-axis) for a modern cultivated crop plant (dashed line 2) and its wild ancestor (solid line 1). Below the plot, the structure of the gene is shown: boxes indicate exons, with grey areas being protein-coding regions and white areas being untranslated regions.
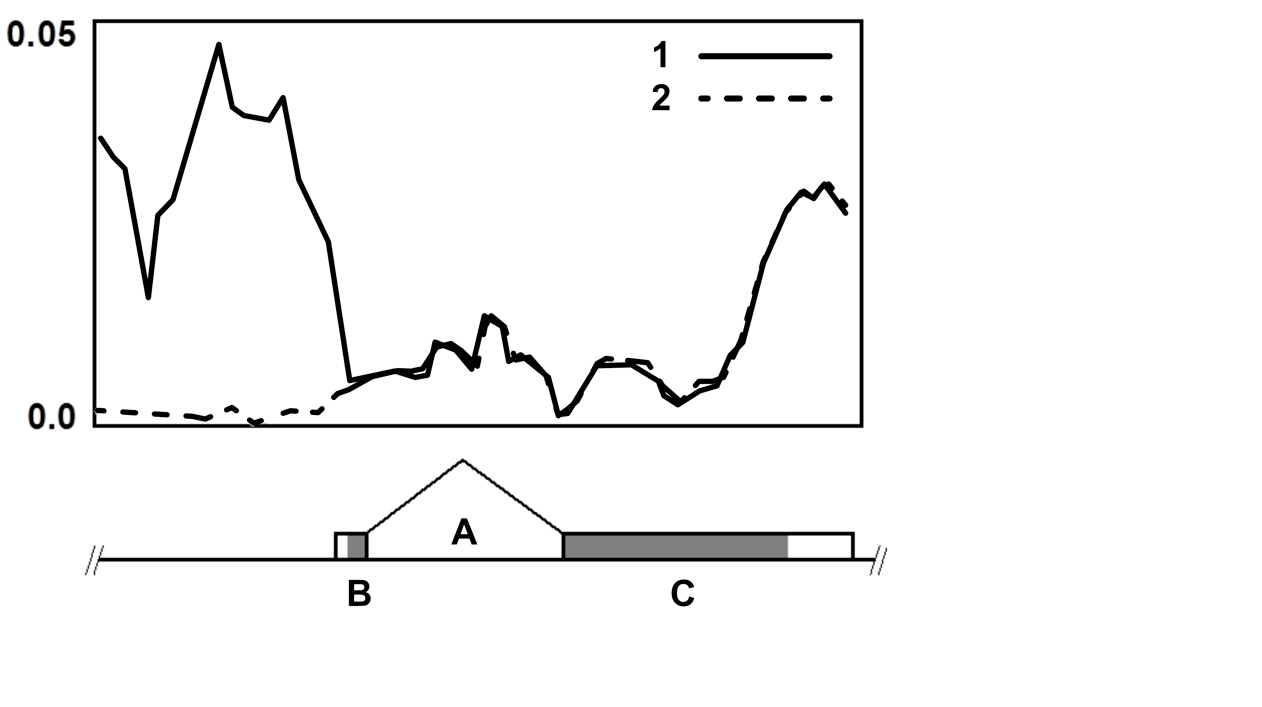 Figure 2. Nucleotide diversity along gene Y. Line 1 (solid) = wild ancestor, Line 2 (dashed) = cultivated crop. A = Intron, B = Exon 1, C = Exon 2.
It has been concluded from the results in Figure 2 that a mutation in this locus was positively selected during the domestication process.
Question reproduced from IBO 2023, Theoretical Paper 1, licensed under CC BY-NC-SA 4.0 - attributed to the International Biology Olympiad. Open the full exam PDF