Q32 - Venus Flytrap Closure: Temperature and Chemical Effects
Venus flytrap is a carnivorous plant. In an experiment, researchers measured how Venus flytraps close at different temperatures (Figure 1A and Figure 1B) and in response to electrical stimulation (Figure 1C). The soil was treated with substance A for 4.5 hours before the electrical stimulation (curve 3, Figure 1C). After that, soil in the vicinity of the Venus flytrap was washed several times with distilled water (curve 4, Figure 1C).
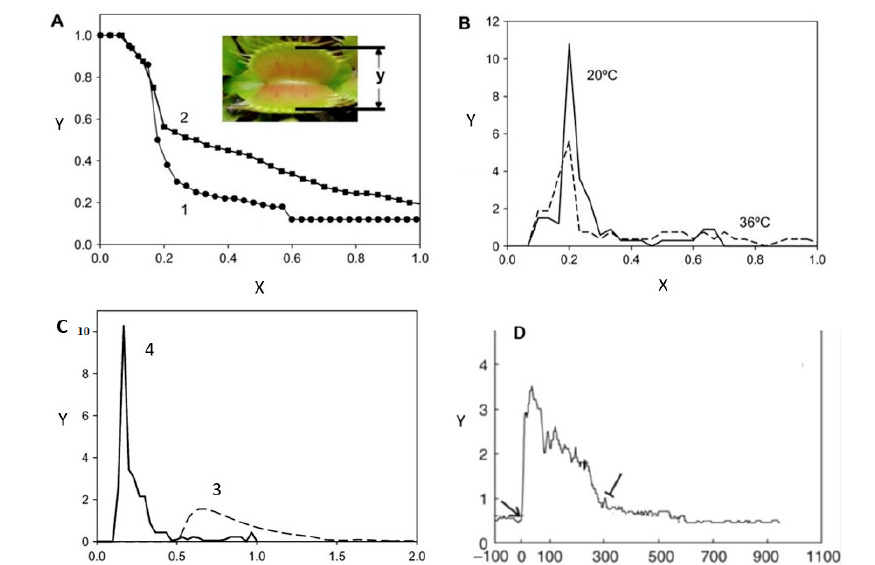 Figure 1. For A, B, C: X - time (s) after stimulation. A Trap closure after an electrical stimulation at temperatures 20°C and 36°C; Y = y/ymax, where ymax is the trap’s maximally open distance. B The same data from graph A, showing temperature’s influence on the speed of trap closure; Y = speed (1/s). C Trap-closure speed due to electrical stimulation; Y = speed (1/s). D Y = rate of respiration (µmol/m²·s) in the trap leaf due to repeated trigger-hair stimulation in already-closed traps; X = time (s). Arrow = stimulation begins, blunted arrow = stimulation ends.
On your answer sheet, indicate “T” for true statements and “F” for false ones.
Question reproduced from IBO 2024, Theoretical Exam Part B, licensed under CC BY-NC-SA 4.0 - attributed to the International Biology Olympiad. Open the full exam PDF