Q80 - Species Differences in Oxygen Dissociation and the Bohr Effect
Figure Q.80 demonstrates the relationship between oxygen concentration and oxygen partial pressure (PO2) in blood of two species of vertebrates (species a and b). Each sample was subjected to two levels of carbon dioxide pressure (PCO2): curve I represents the values measured at normal PCO2 and curve II represents the values measured at elevated PCO2. The blood having passed through the lungs of the two species normally has a PO2 of 100 mm Hg and the deoxygenated blood leaving the tissues has a PO2 of 40 mm Hg.
Figure Q.80
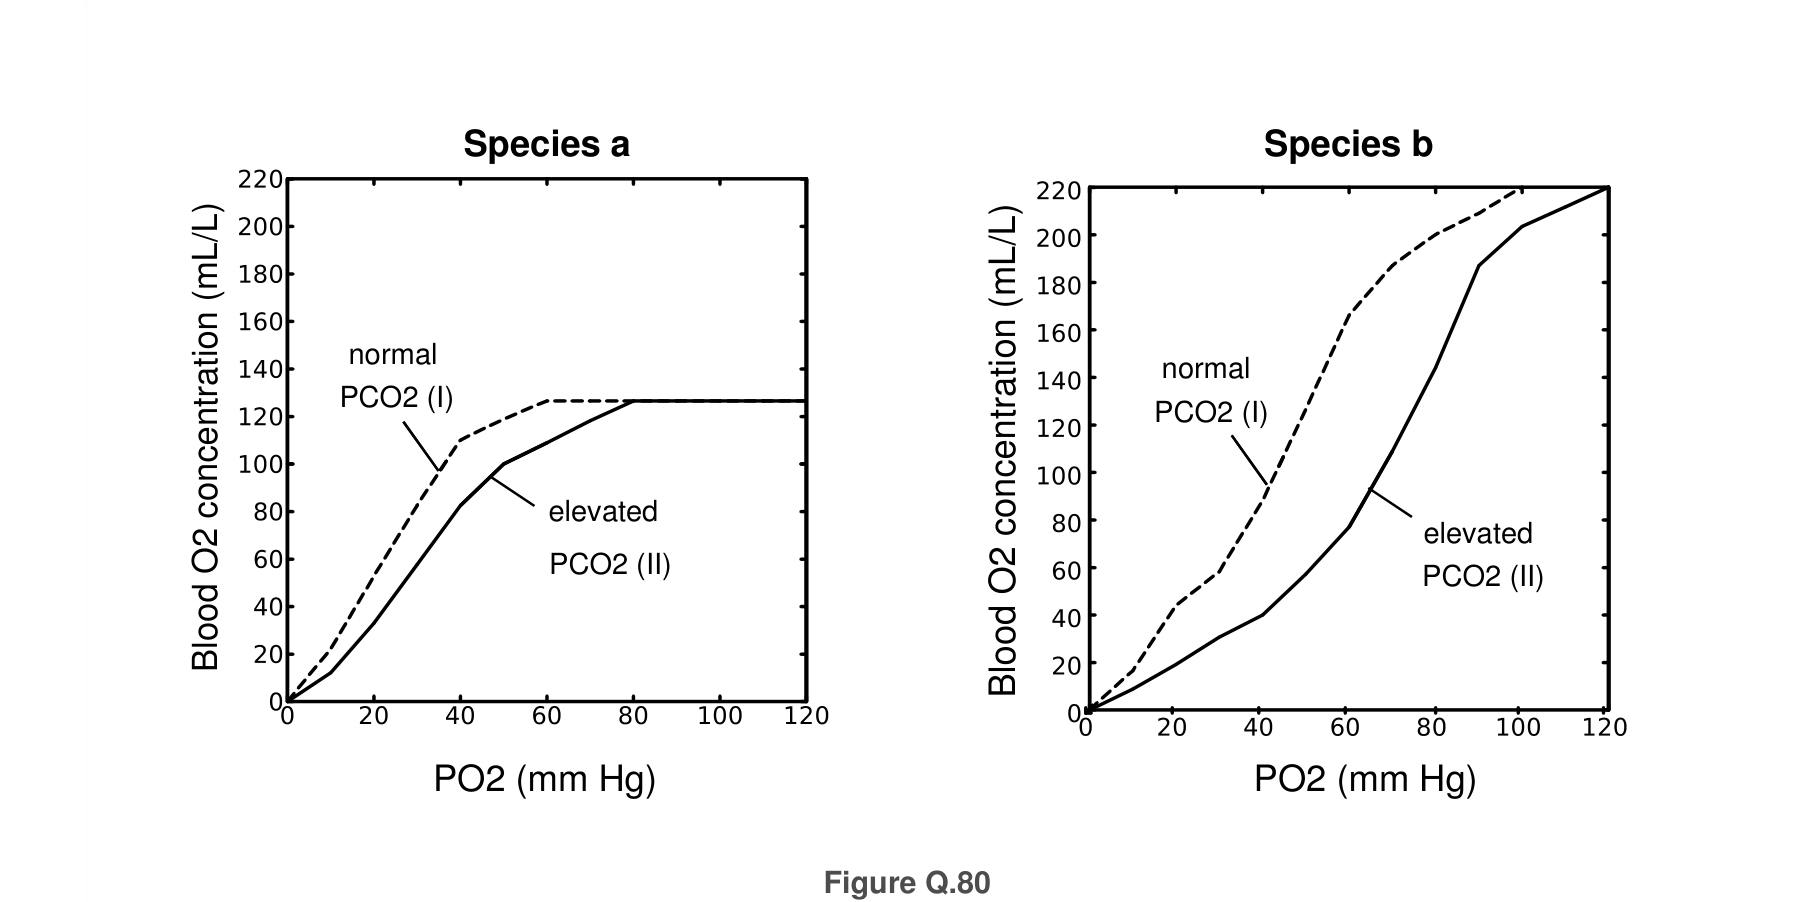 Figure 1.
Using the information and data, determine which of the statements are true or which are false.
Question reproduced from IBO 2016, Theoretical Paper B, licensed under CC BY-NC-SA 4.0 - attributed to the International Biology Olympiad. Open the full exam PDF · Community solutions (unofficial)