Q31 - Smallmouth Bass Removal and Population Structure
Ecology
The smallmouth bass (Micropterus dolomieu) is an introduced species in the area examined in the following experiment. To protect native fish species, a smallmouth bass removal program was initiated in Little Moose Lake in 2000 (indicated by the vertical dashed line). It continued until 2007. A research group examined the effect of the removal on the smallmouth bass population. They found that while the total biomass of the population decreased during the program, the population size increased. To determine the cause, they subdivided the population into three groups based on individual size: yearlings (<100mm, panel a), juveniles (100-200mm, panel b) and adults (>200mm, panel c). They collected two samples each year (spring and fall).
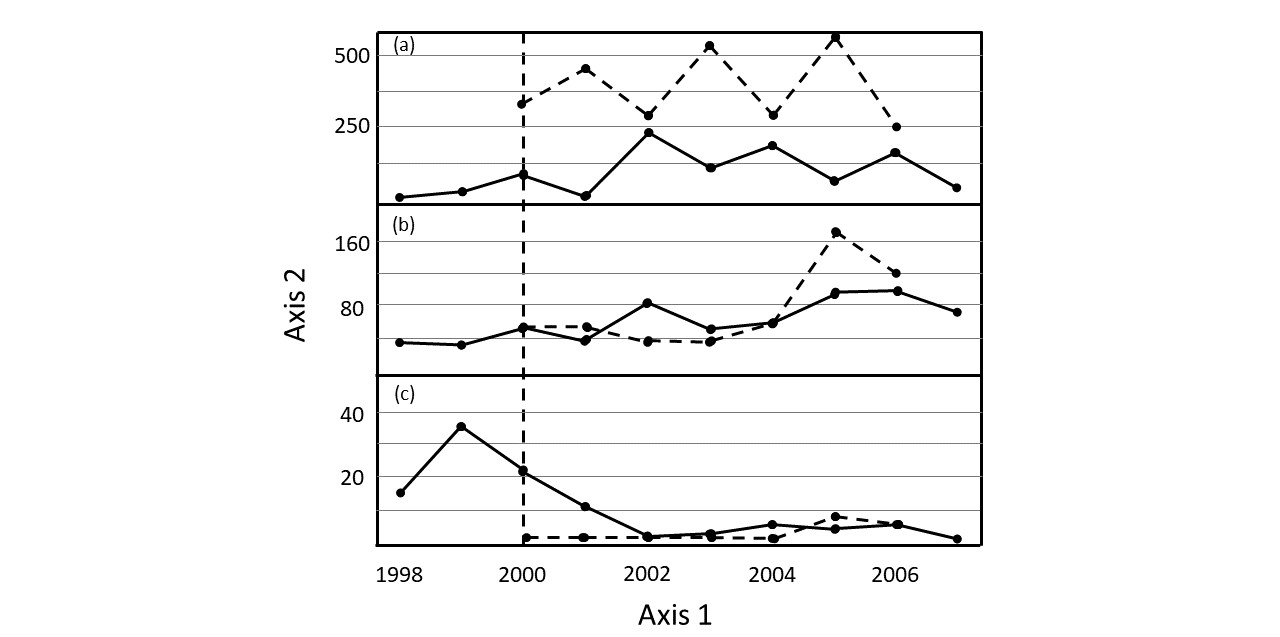 Fig.1. The change in abundance of the subpopulations (y-axis) over time (x-axis). Solid lines = spring samplings, dashed lines = fall samplings. Axis 1 = Year. Axis 2 = Catch per unit effort (CPUE).
Which of the following models can possibly describe how the removal of individuals affected the population? Indicate with an X if each of the following models can (T) or cannot (F) describe the changes.
Question reproduced from IBO 2019, Theoretical Exam A, licensed under CC BY-NC-SA 4.0 - attributed to the International Biology Olympiad. Open the full exam PDF · Official answer key