The population dynamics of parasite species is complex, because the size of the parasite and host populations affect each other. One popular model is the SIR model (Susceptible – Infected – Recovered). You can get the changes in host-type numbers by multiplying the original host number by the factor above the arrow - for example, the number of hosts recovering in a given time is $\gamma \cdot I$.
Fig.1. The SIR model. S = susceptible hosts. I = infected and infectious hosts. R = recovered/immune hosts. N = total host population = S+I+R. b = per capita birth rate. β = transmission rate (contact rate × infectiousness). μ = mortality rate without disease. α = mortality rate due to disease. γ = host recovery rate from infection.
Indicate with an X if each of the following statements are true (T) or false (F).
Give the relationship between the ratio of infected (I) to the sum of susceptible and infected (S+I) individuals, and the number of new infections in a given time. Draw the curve of the equation in the coordinate system below (transmission rate β is constant).
Fig.2. The number of new infections in a given time as a function of the ratio of infected hosts (I) to the sum of susceptible and infected hosts (S+I). Max. = the maximal value of the new infections. Axis = Number of new infections.
Many parasites cause diseases with a high mortality rate (α), despite the death of the host being evidently disadvantageous for the parasite. Indicate with an X if each of the following statements are true (T) or false (F).
Q32.1. In the SIR model (S=susceptible, I=infected, R=recovered/immune, β=transmission rate, μ=background mortality, α=disease mortality, γ=recovery rate), the mortality rate of infected hosts is higher than the others'.
Q32.2. The average number of offspring of surviving individuals is higher for non-infected hosts than for infected ones.
Q32.3. The parasite can be transmitted both vertically (parent to offspring before birth) and horizontally (infection after birth).
Q32.4. Individuals who recovered from the disease will be immune to it for the rest of their life.
Q32.5. The number of new infections in a given time depends only on the number of susceptible hosts, unaffected by the number of infected or recovered hosts.
Q32.6. Give the relationship between the ratio I/(S+I) and the number of new infections in a given time (transmission rate β constant), and sketch the curve.
An upside-down U (parabola-like) curve: new infections start at 0 when I/(S+I)=0, rise to a single maximum at some intermediate ratio, then fall back to 0 as I/(S+I) approaches 1.: New infections per unit time scale with contacts between S and I individuals, proportional to both S and I, expressed as a fraction of the total (S+I), this is a product of two quantities that trade off against each other (more I means less S, and vice versa), which is maximised at an intermediate mix and drops to zero at either extreme (all-S or all-I, where there's no one left to newly infect either because there are no infected contacts to spread it, or no susceptibles left to infect), the classic humped/parabolic shape shown in the official key's answer graph.
Q32.7. Higher transmission rate (β) is advantageous for the parasite, but usually high infectiousness means the parasite causes more harm to the host.
Q32.8. The bigger the disease mortality rate (α), the bigger the ratio of susceptible hosts in the population, so the parasite spreads easier.
Q32.9. There may be a long incubation period after infection, during which the parasite has enough time to spread before the host dies.
Q32.10. A big mortality rate (α) doesn't cause a problem for the parasite, if the transmission rate (β) is low.
Q32.11. If weakening of the host body results in a lower host recovery rate (γ), that will cause a higher mortality rate for the whole population.
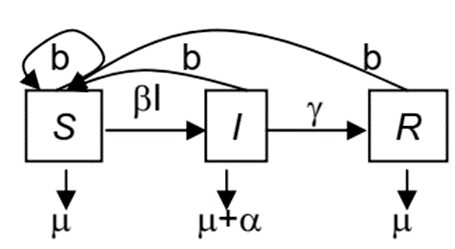 Fig.1. The SIR model. S = susceptible hosts. I = infected and infectious hosts. R = recovered/immune hosts. N = total host population = S+I+R. b = per capita birth rate. β = transmission rate (contact rate × infectiousness). μ = mortality rate without disease. α = mortality rate due to disease. γ = host recovery rate from infection.
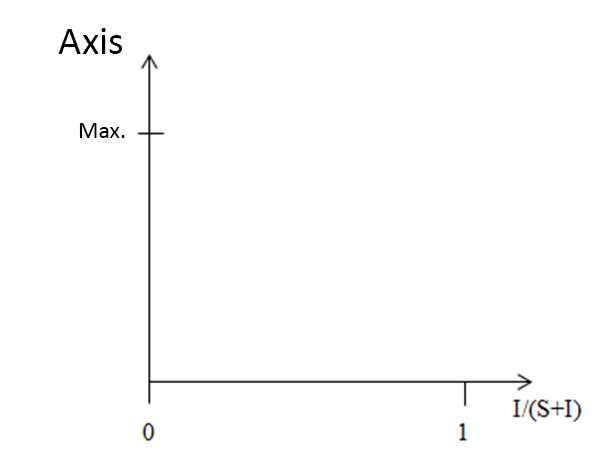 Fig.2. The number of new infections in a given time as a function of the ratio of infected hosts (I) to the sum of susceptible and infected hosts (S+I). Max. = the maximal value of the new infections. Axis = Number of new infections.