Q49 - Species Dominance-Rank Curves and Community Change Over 50 Years
Scientists monitored the number of individuals for ant species in a 5 hectare plot of land for 50 years. The below figures represent the dominance rank of observed species in terms of their abundance, that is, the number of individuals for each species. Each open circle represents the value for each species. Note that the most abundant species is given rank 1.
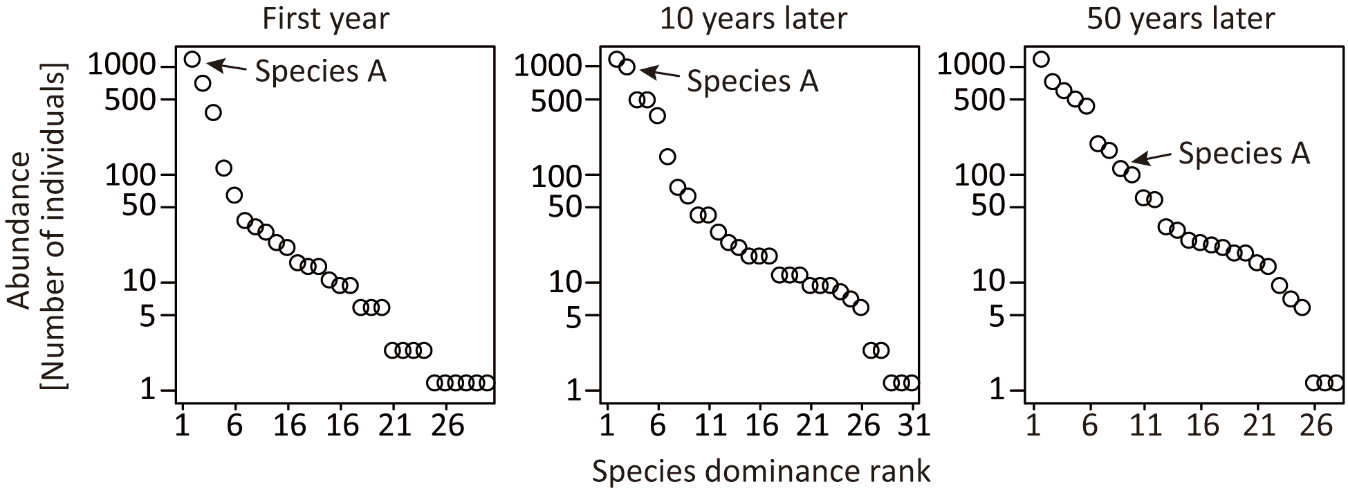 Figure 1.
Using the information and data, determine which of the statements are true or which are false.
A. The total number of species does not change in the three periods observed.
B. Species A has gradually outcompeted other species over time.
C. The top three species account for more than 75% of the total number of individuals in the first year.
D. The gradual decrease in the slope of the rank-abundance curve indicates the increase in evenness with time.
Question reproduced from IBO 2020, Theoretical Exam 1, licensed under CC BY-NC-SA 4.0 - attributed to the International Biology Olympiad. Open the full exam PDF · Community solutions (unofficial)