Q38 - Modes of Natural Selection - Frequency Distribution Curves
There are different modes of natural selection: stabilizing selection, directional selection, and disruptive selection. The figure below shows three frequency-distribution curves (in no particular order) shifting in the course of natural selection.
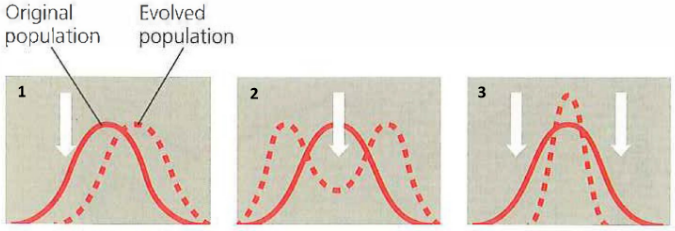 Figure 1. The possible effects of natural selection on frequency distribution for some trait - original population (solid) vs. evolved population (dashed), in three unlabelled panels (1, 2, 3).
Using the information and images, determine whether the following statements are true or false:
A. Stabilizing selection is the only mode of selection, where the population median stays the same.
B. In response to all plants producing harder seeds, a species of finches evolved to have larger beaks, as represented by curve 2.
C. For a population of finches, the largest seeds and the smallest seeds have become the most abundant as resources. This is represented by curve 2.
D. The Siberian husky has to evolve enough muscle mass to pull a sledge, but not enough to fall into the snow due to its weight. This evolutionary process is represented by curve 3.
Question reproduced from IBO 2022, Theoretical Paper 1, licensed under CC BY-NC-SA 4.0 - attributed to the International Biology Olympiad. Open the full exam PDF · Community solutions (unofficial)