Q20 - Flycatcher Song Dialects and Species Discrimination
The pied flycatcher (Ficedula hypoleuca) and collared flycatcher (F. albicollis) are two closely related and morphologically very similar bird species.
Their cross-species hybrids are completely sterile.
Their geographical distributions partially overlap (Figure 1A).
A recent study recorded songs of 168 male flycatchers of both species from different geographic locations. Various acoustic parameters of individual songs were measured, and differences between songs were visualized using principal component analysis (PCA) (Figure 1B). PCA integrates different parameters of the song and transforms them into principal components (PC), which allows for the reduction of multidimensional data to a few dimensions (two in this case, PC1 and PC2). Similar songs will have similar values for a given principal component.
The recorded songs were also played to F. hypoleuca nestlings and the nestlings’ begging calls in response to the songs were counted (Figures 2 and 3).
In this study, the rate at which nestlings responded to the played male songs from their population did not correlate with how similar the played songs were to the songs of their social fathers. Social fathers are the males whose calls nestlings hear most often.
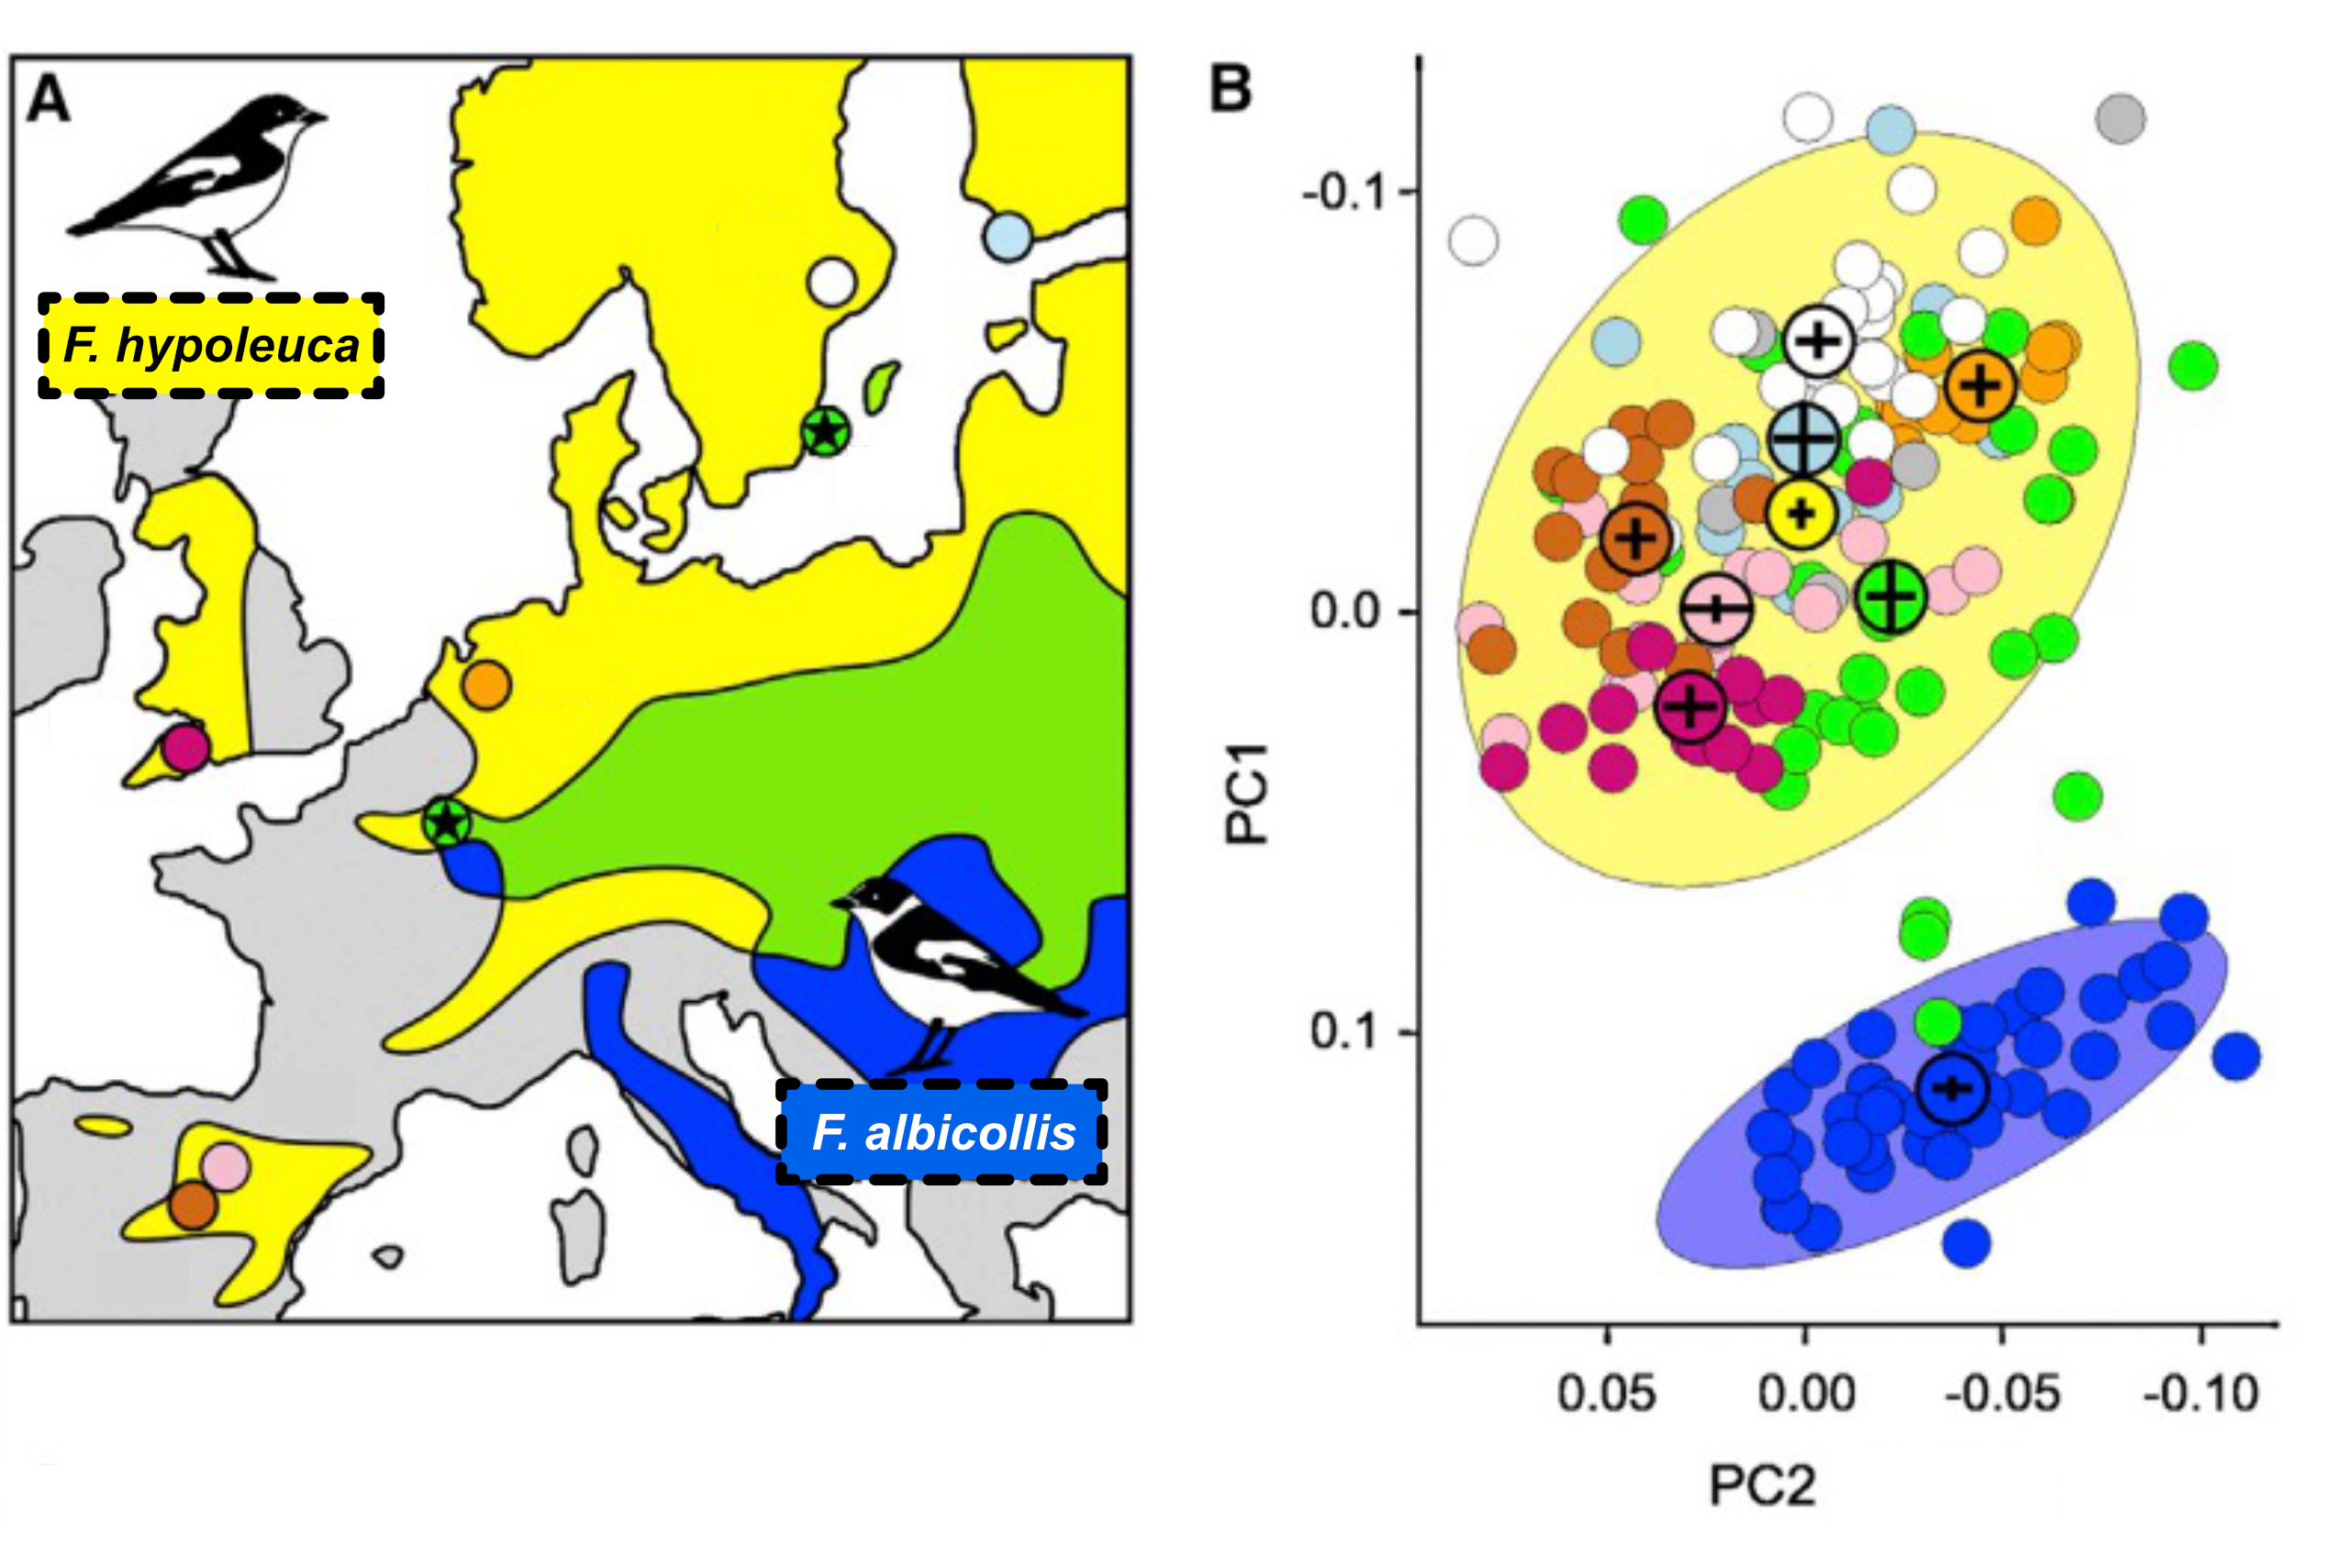 Figure 1. A: Geographic distribution of F. hypoleuca (yellow) and F. albicollis (blue), with overlap (green). Colored dots show F. hypoleuca populations used in the study. B: PCA of individual songs. Each dot represents one individual’s song. Yellow and blue ellipses enclose 95% of the data points for each species.
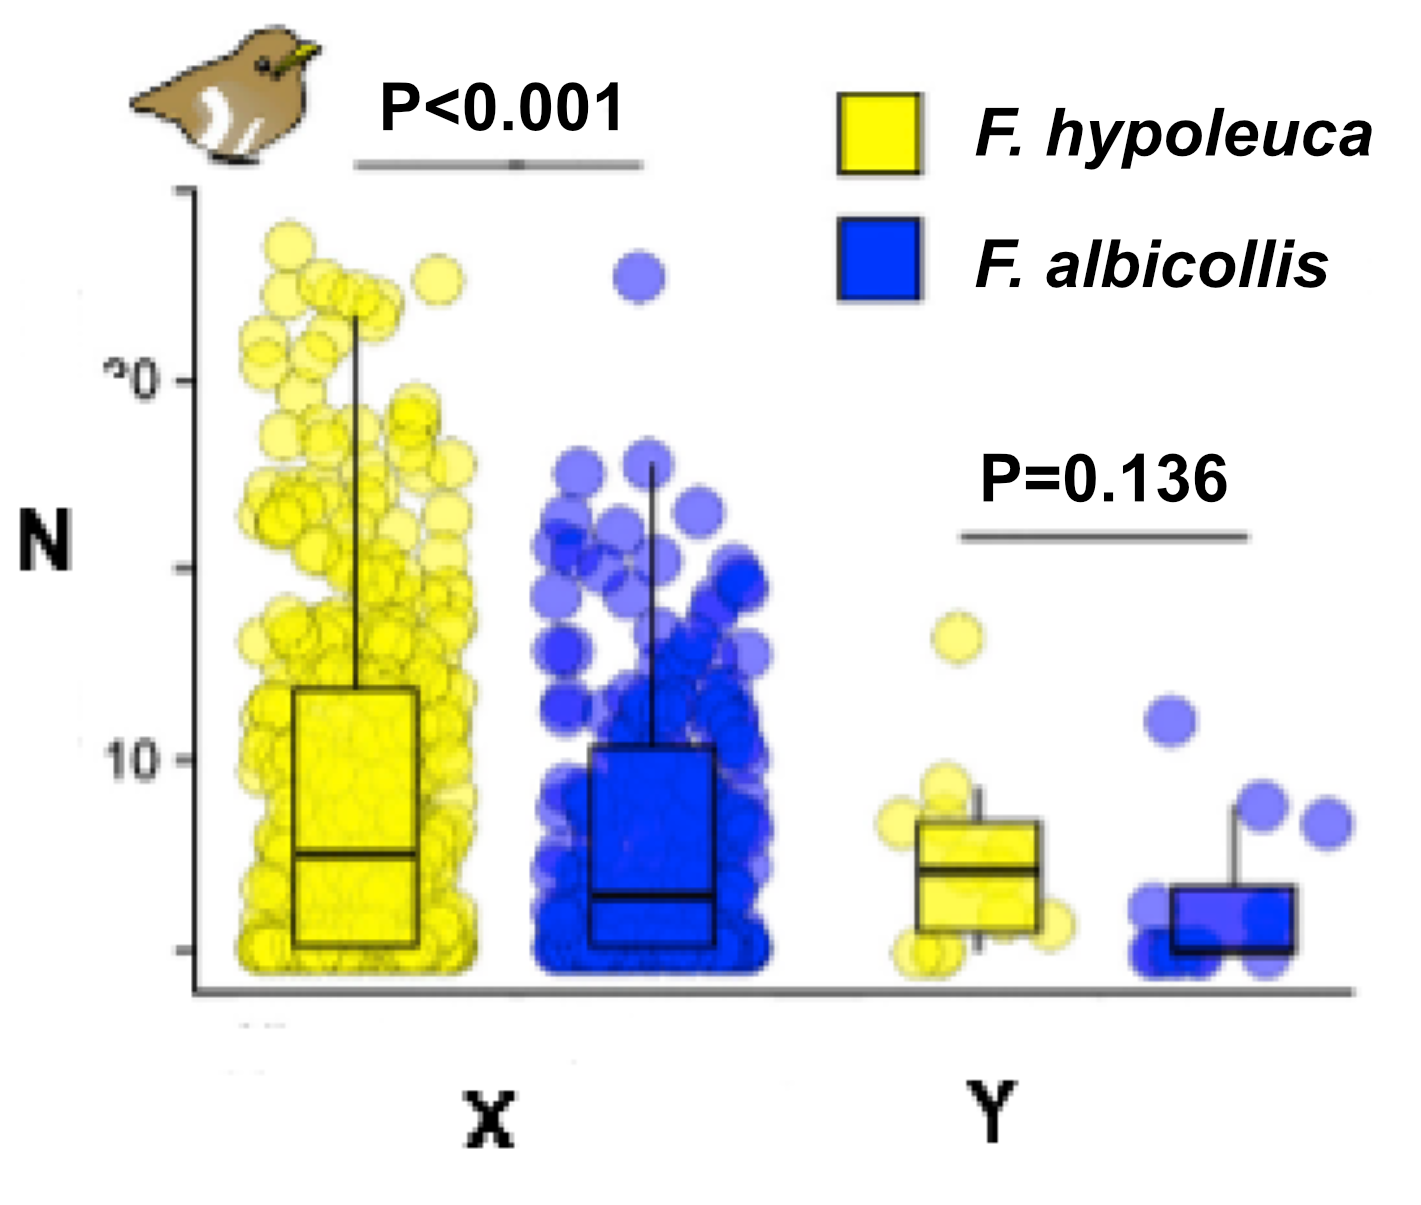 Figure 2. Begging calls (N) by F. hypoleuca nestlings. Left: Allopatry (6 populations, 347 clutches). Right: Sympatry (1 population, 37 clutches). Yellow = F. hypoleuca songs, Blue = F. albicollis songs.
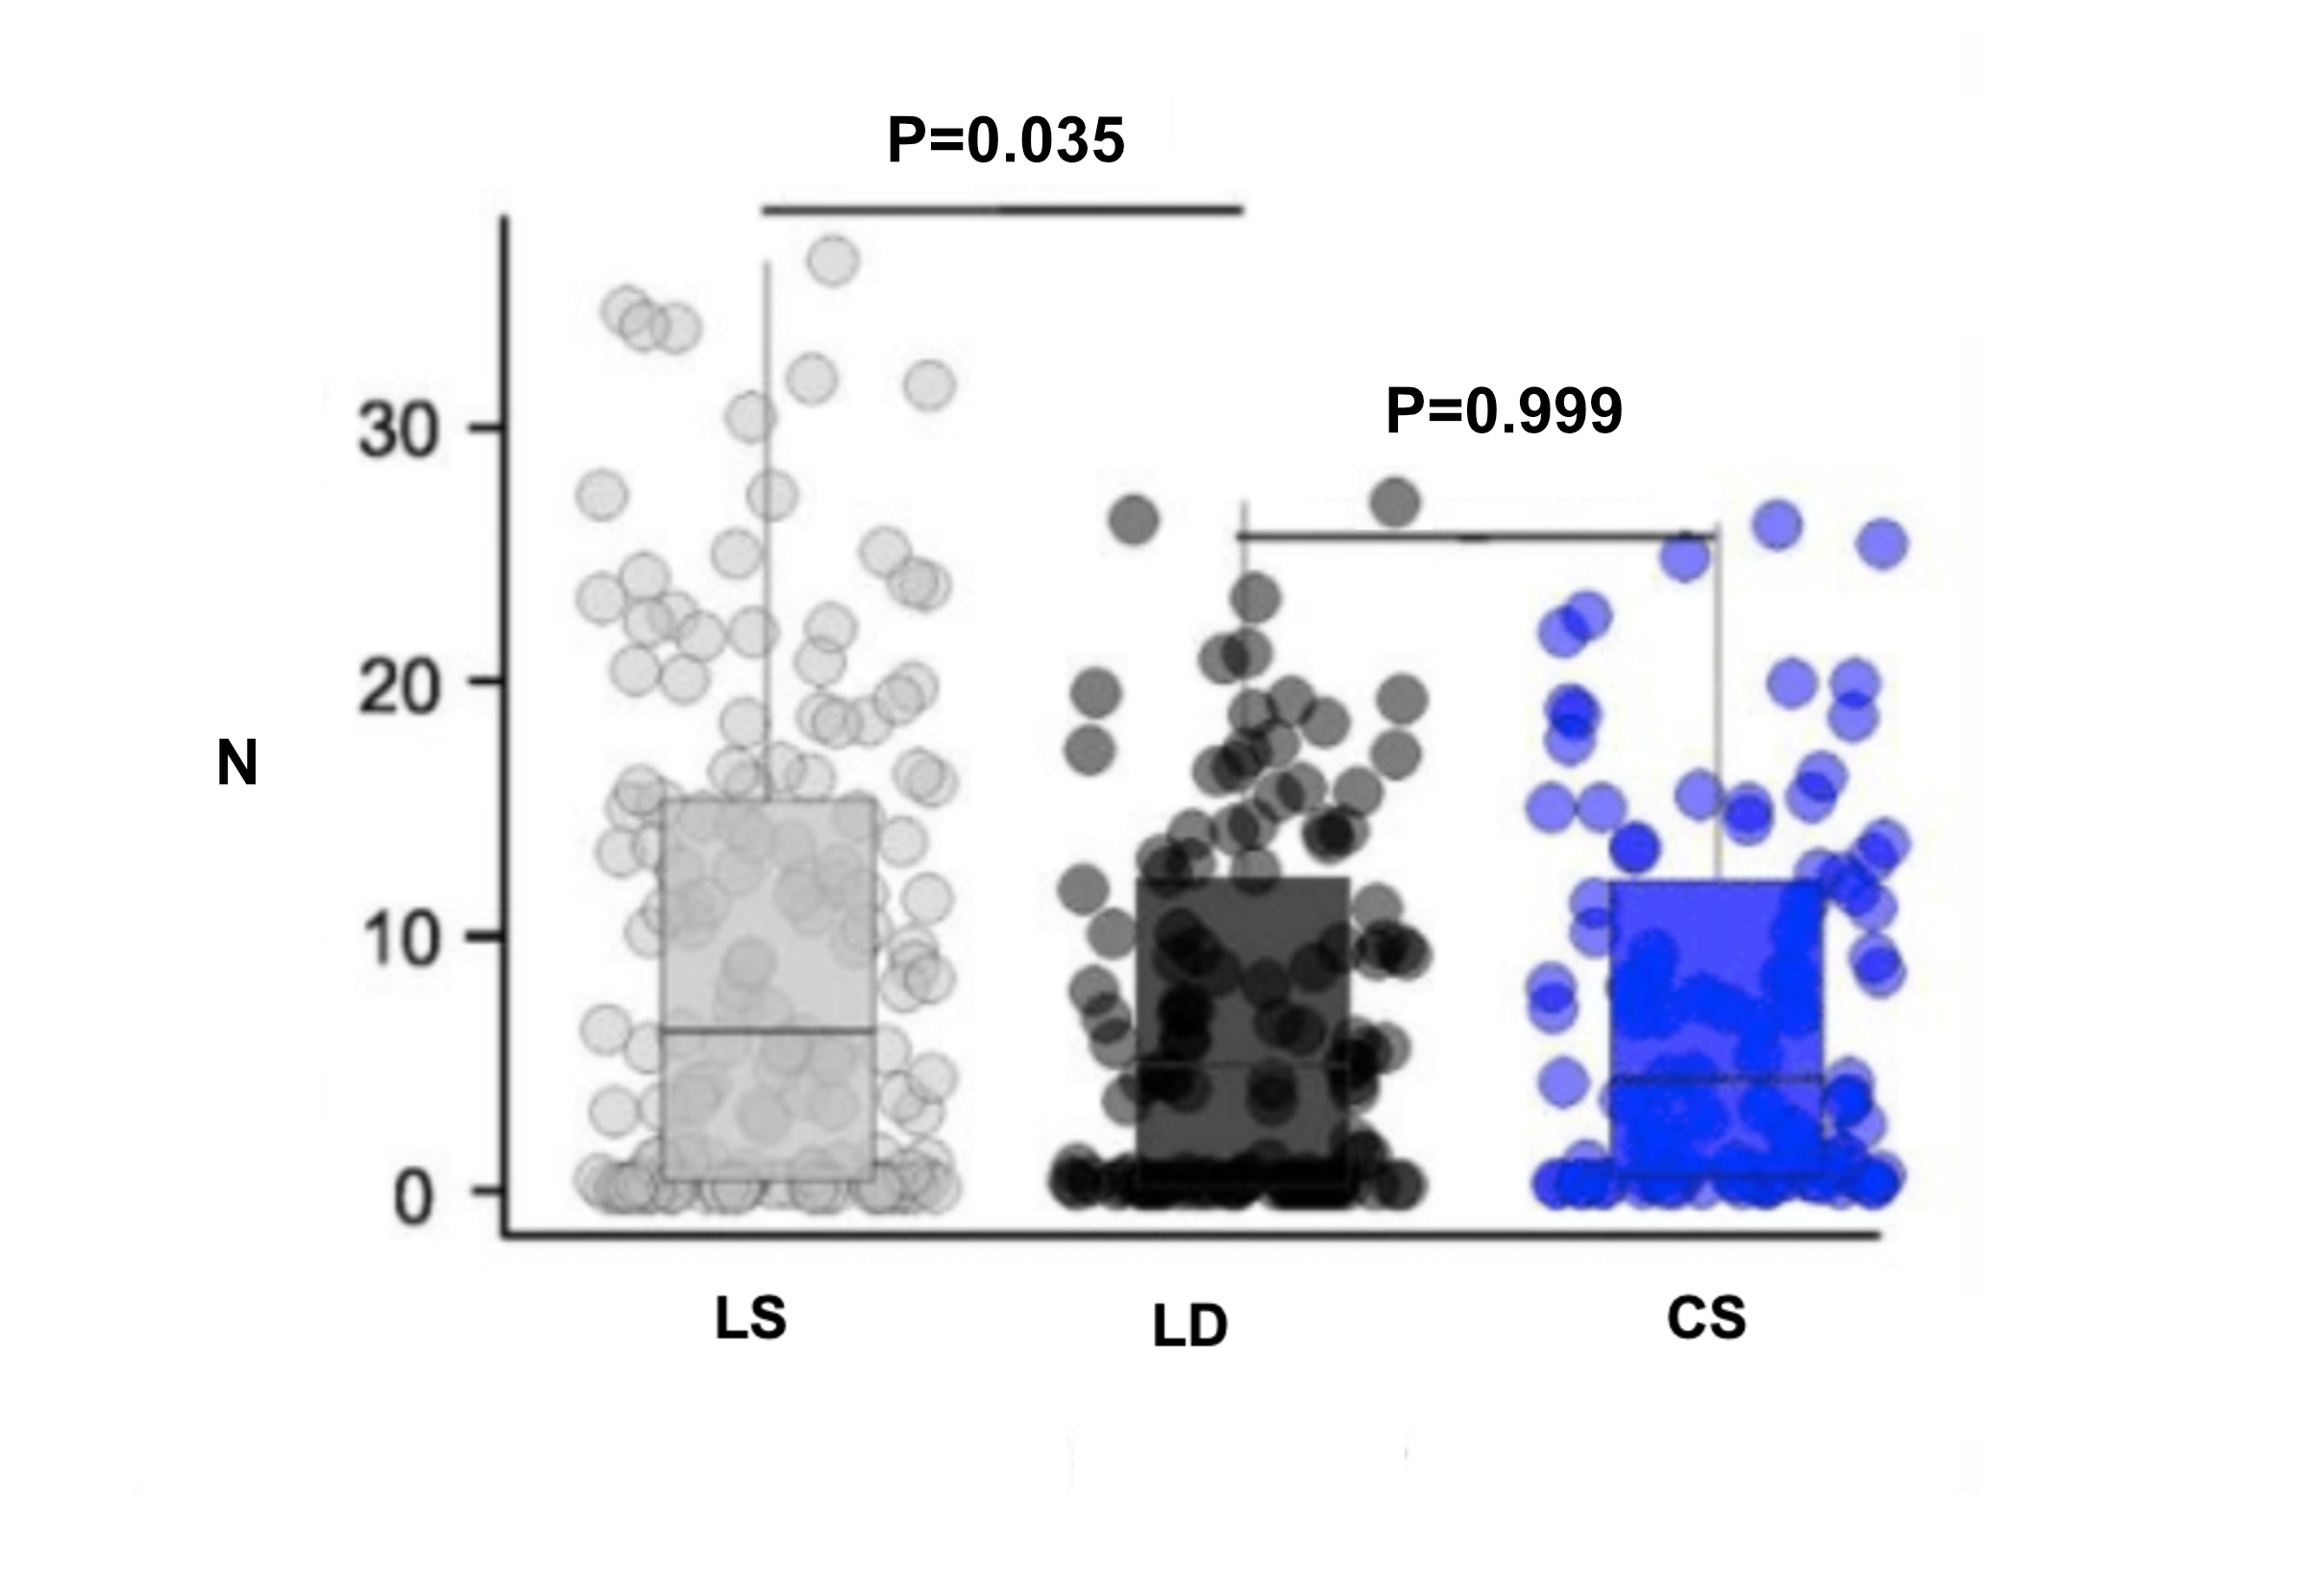 Figure 3. Begging calls (N) by F. hypoleuca nestlings in response to: LS = songs similar to local population (grey), LD = songs dissimilar to local population (black), CS = songs similar to F. albicollis (blue).
Question reproduced from IBO 2023, Theoretical Paper 1, licensed under CC BY-NC-SA 4.0 - attributed to the International Biology Olympiad. Open the full exam PDF