Q38 - ECG Interpretation
An electrocardiogram (ECG) records the heart’s electrical activity using electrodes on the skin. Leads I, II, and III form Einthoven’s triangle and provide key views of the heart’s electrical axis by measuring voltage differences between the limbs. Lead I measures between the right and left arms, Lead II between the right arm and left leg, and Lead III between the left arm and left leg. In modern diagnostic medicine, 12 leads are used for a more comprehensive analysis of the heart’s activity.
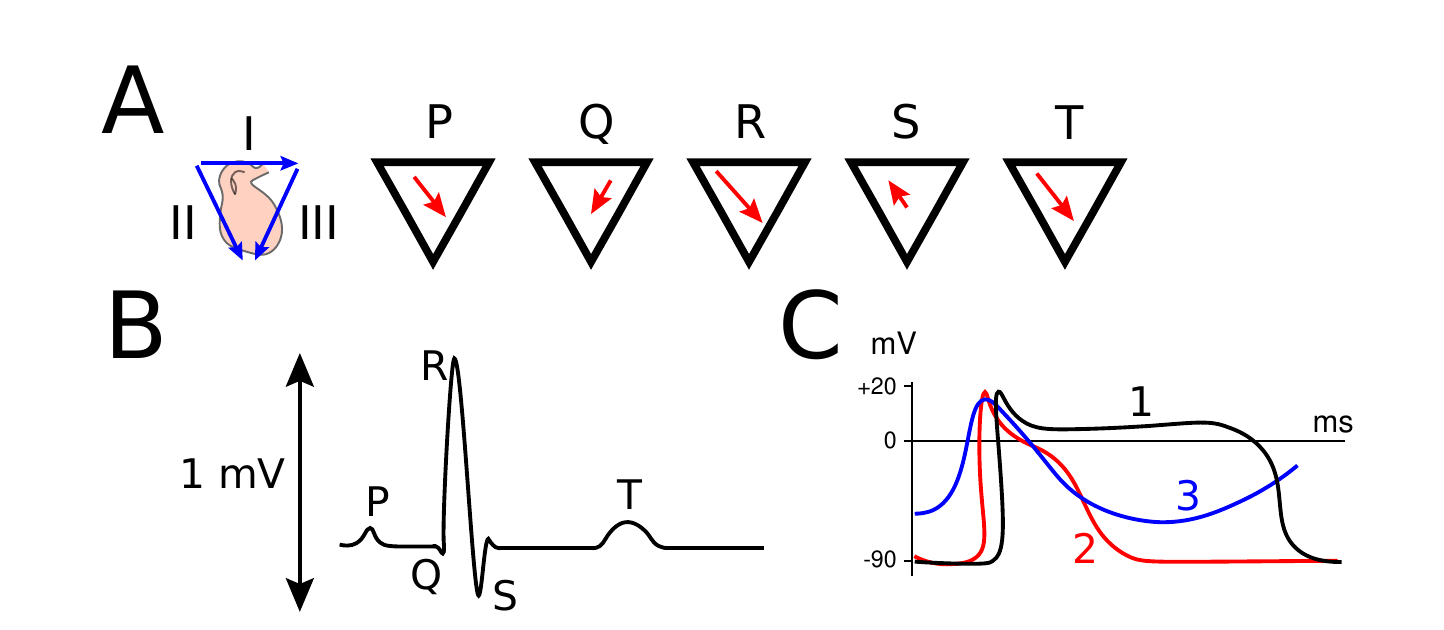 Figure 1. A Leads I, II, and III form Einthoven’s triangle with red vectors showing the heart’s mean current direction and amplitude. B ECG measurements along lead II with P wave, QRS complex, and T wave. C Membrane potential of cardiomyocytes from different heart regions during the cardiac cycle.
On your answer sheet, indicate “T” for true statements and “F” for false ones.
Question reproduced from IBO 2024, Theoretical Exam Part A, licensed under CC BY-NC-SA 4.0 - attributed to the International Biology Olympiad. Open the full exam PDF · Community solutions (unofficial)