Q15 - Lotka-Volterra Competition Lines and Coexistence Outcomes
The Lotka-Volterra model is used to predict the dynamics of competing populations. It is based on the following equations and is analyzed by constructing specific lines:
$$\frac{dN_1}{dt} = r_1 N_1 \left(\frac{K_1 - N_1 - \alpha N_2}{K_1}\right), \qquad \frac{dN_2}{dt} = r_2 N_2 \left(\frac{K_2 - N_2 - \beta N_1}{K_2}\right)$$
where K - carrying capacity, N - number of individuals, r - intrinsic rate of increase, α - competition coefficient of species 2 on species 1, β - competition coefficient of species 1 on species 2, and dN/dt = population growth rate.
The Lotka-Volterra line represents the number of individuals in a population at equilibrium (dN/dt = 0). For two species in competition, there are only 4 combinations of the location of these lines. Depending on the initial values of populations, the future changes in populations’ dynamics can be predicted.
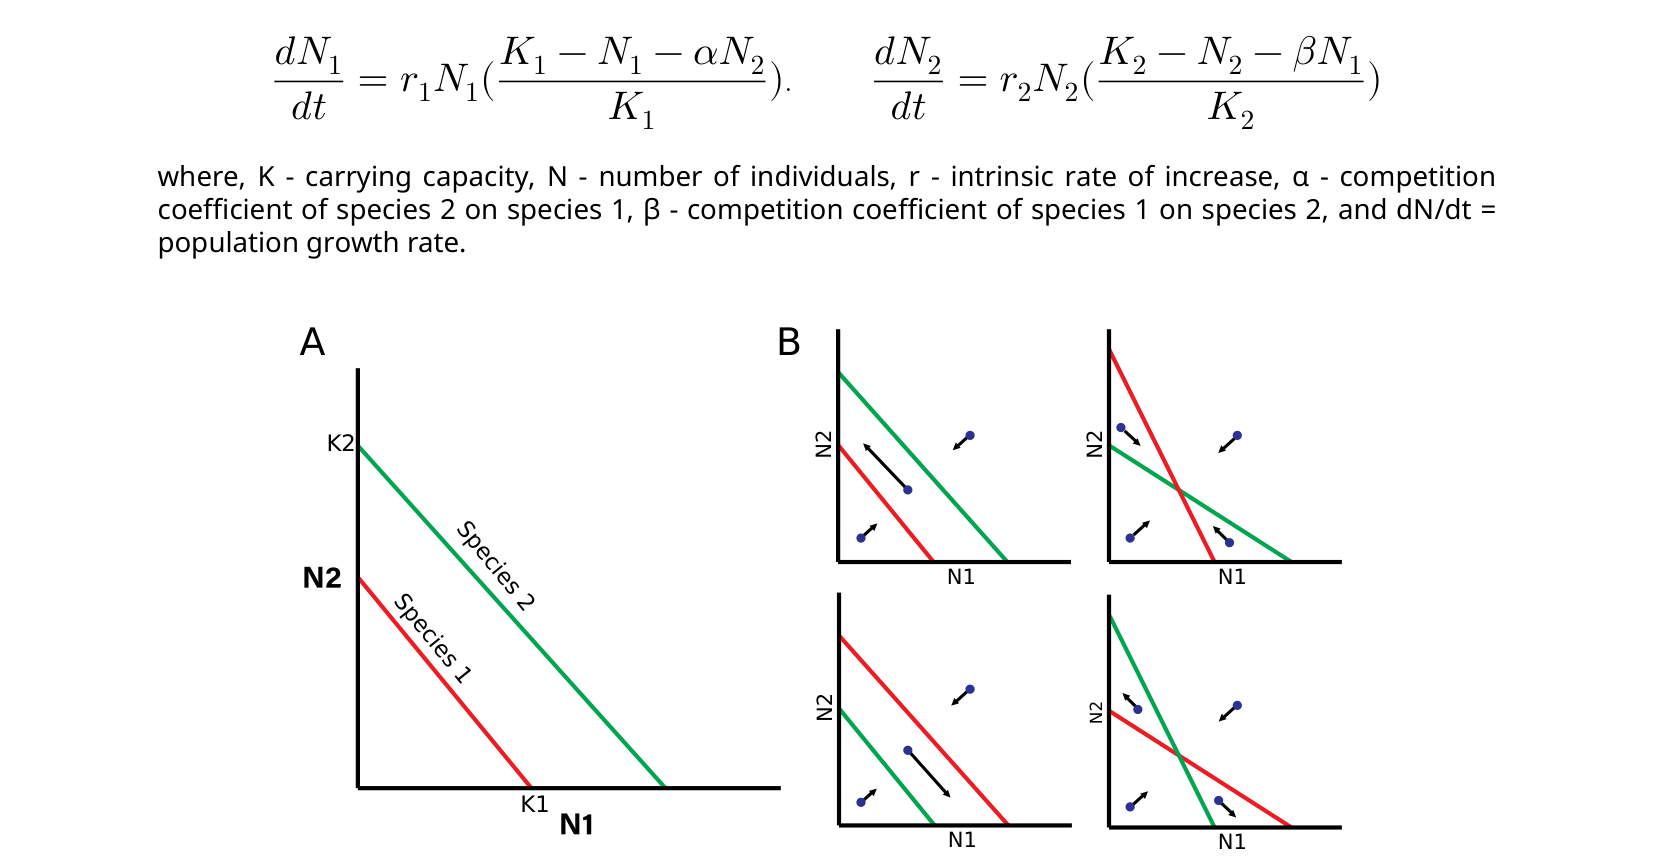 Figure 1. A Lotka-Volterra lines. B Combinations of line locations and trends - arrows show the further direction of populations’ dynamics for particular initial values, indicated by blue dots.
On your answer sheet, indicate “T” for true statements and “F” for false ones.
Question reproduced from IBO 2024, Theoretical Exam Part B, licensed under CC BY-NC-SA 4.0 - attributed to the International Biology Olympiad. Open the full exam PDF