Q66 - Comparing Lead Toxicity Thresholds for Growth and Photosynthesis in Two Microalgae
A study on the effects of lead (Pb), a toxic heavy metal, on growth and photosynthesis of two microalgae, Chlorella and Scenedesmus was conducted. The figure on the left below shows the growth of these strains responded differently to lead concentration after 4 day treatment. From growth rate (Ke), generation time (G) of each strain at each concentration of lead can be calculated as equation: G = (ln2)/Ke. The right hand Figure Q.66 is result of the effect of lead on photosynthesis of these strains, indicated by Fv/Fm, a sensitive parameter that decreases when photosynthesis is impaired. The concentration of lead that gives half-maximal response, the IC50, can be estimated based on response versus lead concentration plots.
Figure Q.66
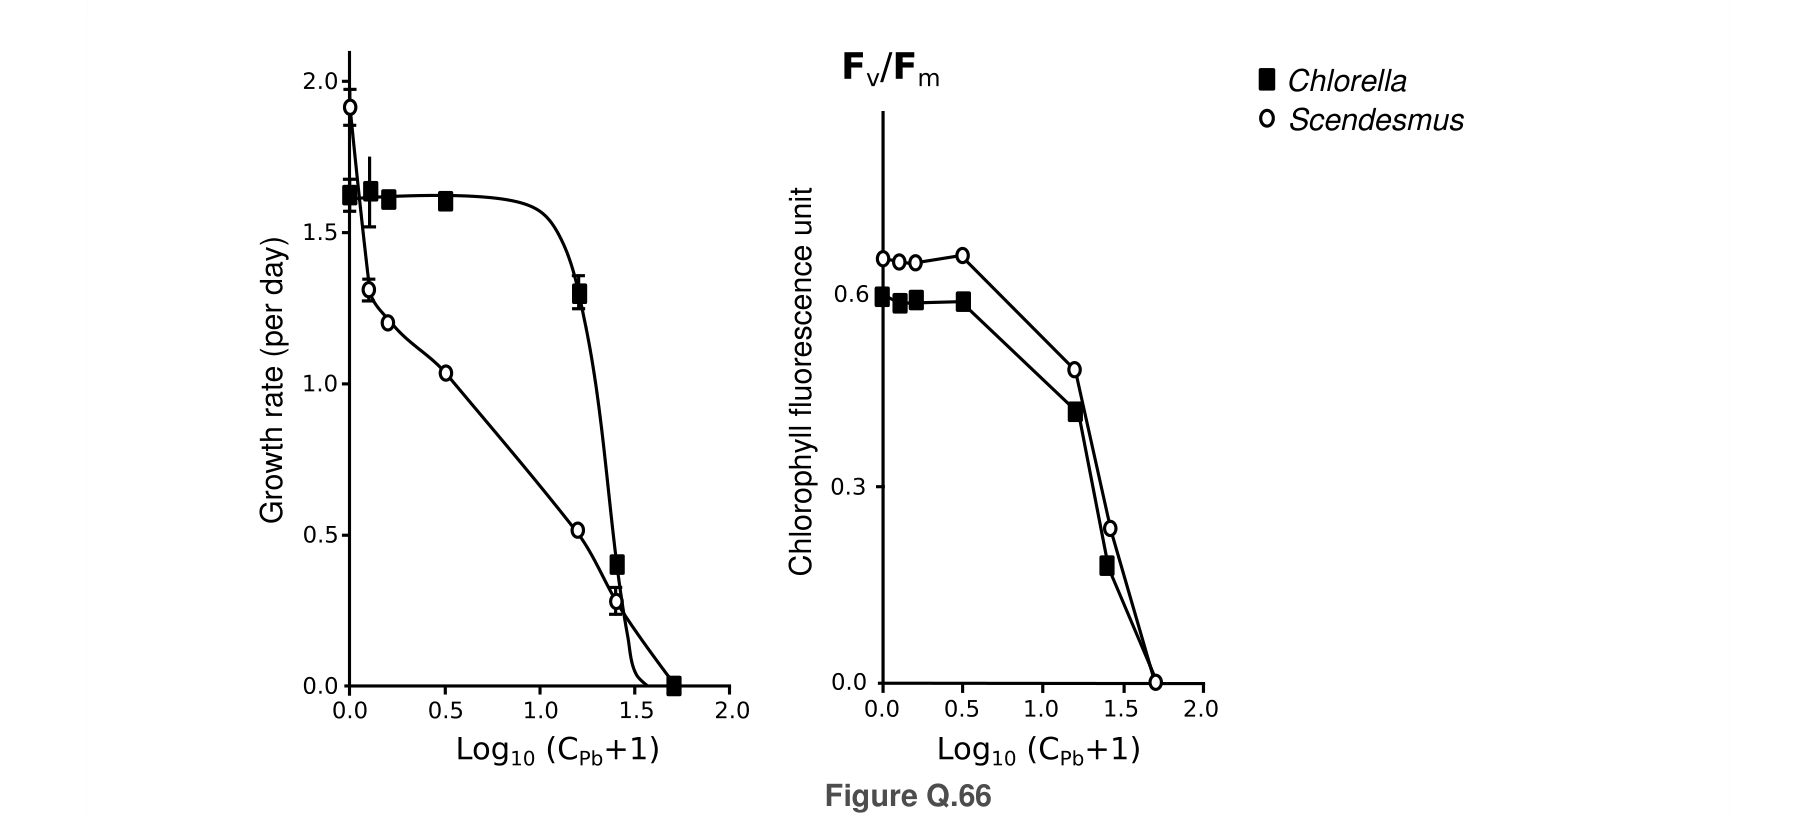 Figure 1.
Using the information and data, determine which of the statements are true or which are false.
Question reproduced from IBO 2016, Theoretical Paper B, licensed under CC BY-NC-SA 4.0 - attributed to the International Biology Olympiad. Open the full exam PDF · Community solutions (unofficial)