Q67 - Gibberellin Signaling and Root/Shoot Allocation in Transgenic Poplar
Scientists constructed gibberellic acid (GA)-deficient and GA-insensitive transgenic lines of poplar plants. They measured concentration of phytohormones, including GA1 and GA4 and IAA, in the leaves and roots of transgenic and wildtype plants (Table Q.67). They also measured the growth of plants in greenhouse and in vitro conditions (Figure Q.67).
Table Q.67 Phytohormone concentrations (ng/g dry weight, mean ± SD) in leaves and roots of the wild type and the two transgenic types. Asterisks (* p<0.05, ** p<0.01) mark values significantly different from wild type.
| Organ | Plant type | GA1 | GA4 | IAA |
|---|---|---|---|---|
| Leaf | Wild-type | 58.1 ± 15.4 | 6.64 ± 3.18 | 22.5 ± 3.1 |
| Leaf | GA-deficient | 19.9 ± 9.4** | 5.53 ± 2.33* | 21.1 ± 5.9 |
| Leaf | GA-insensitive | 139.6 ± 21.9** | 12.2 ± 3.6** | 19.6 ± 3.7 |
| Root | Wild-type | 77.1 ± 29.3 | 2.24 ± 0.74 | 61.4 ± 4.1 |
| Root | GA-deficient | 48.8 ± 9.6** | 1.15 ± 0.62** | 72.9 ± 5.2* |
| Root | GA-insensitive | 97.7 ± 31.5** | 3.93 ± 0.68** | 69.1 ± 9.7* |
Fig.Q.67 A-D: Root and shoot biomass under greenhouse conditions. Top panel shows the fresh biomass of shoots and roots in GA-deficient (A) and GA-insensitive (B) transgenics. Bottom is the shoot/root ratio in GA-deficient (C) and GA-insensitive (D) transgenics. E-J: Root development (lateral and primary root length/density) in GA-deficient and GA-insensitive transgenic lines grown in vitro, compared to wild type.
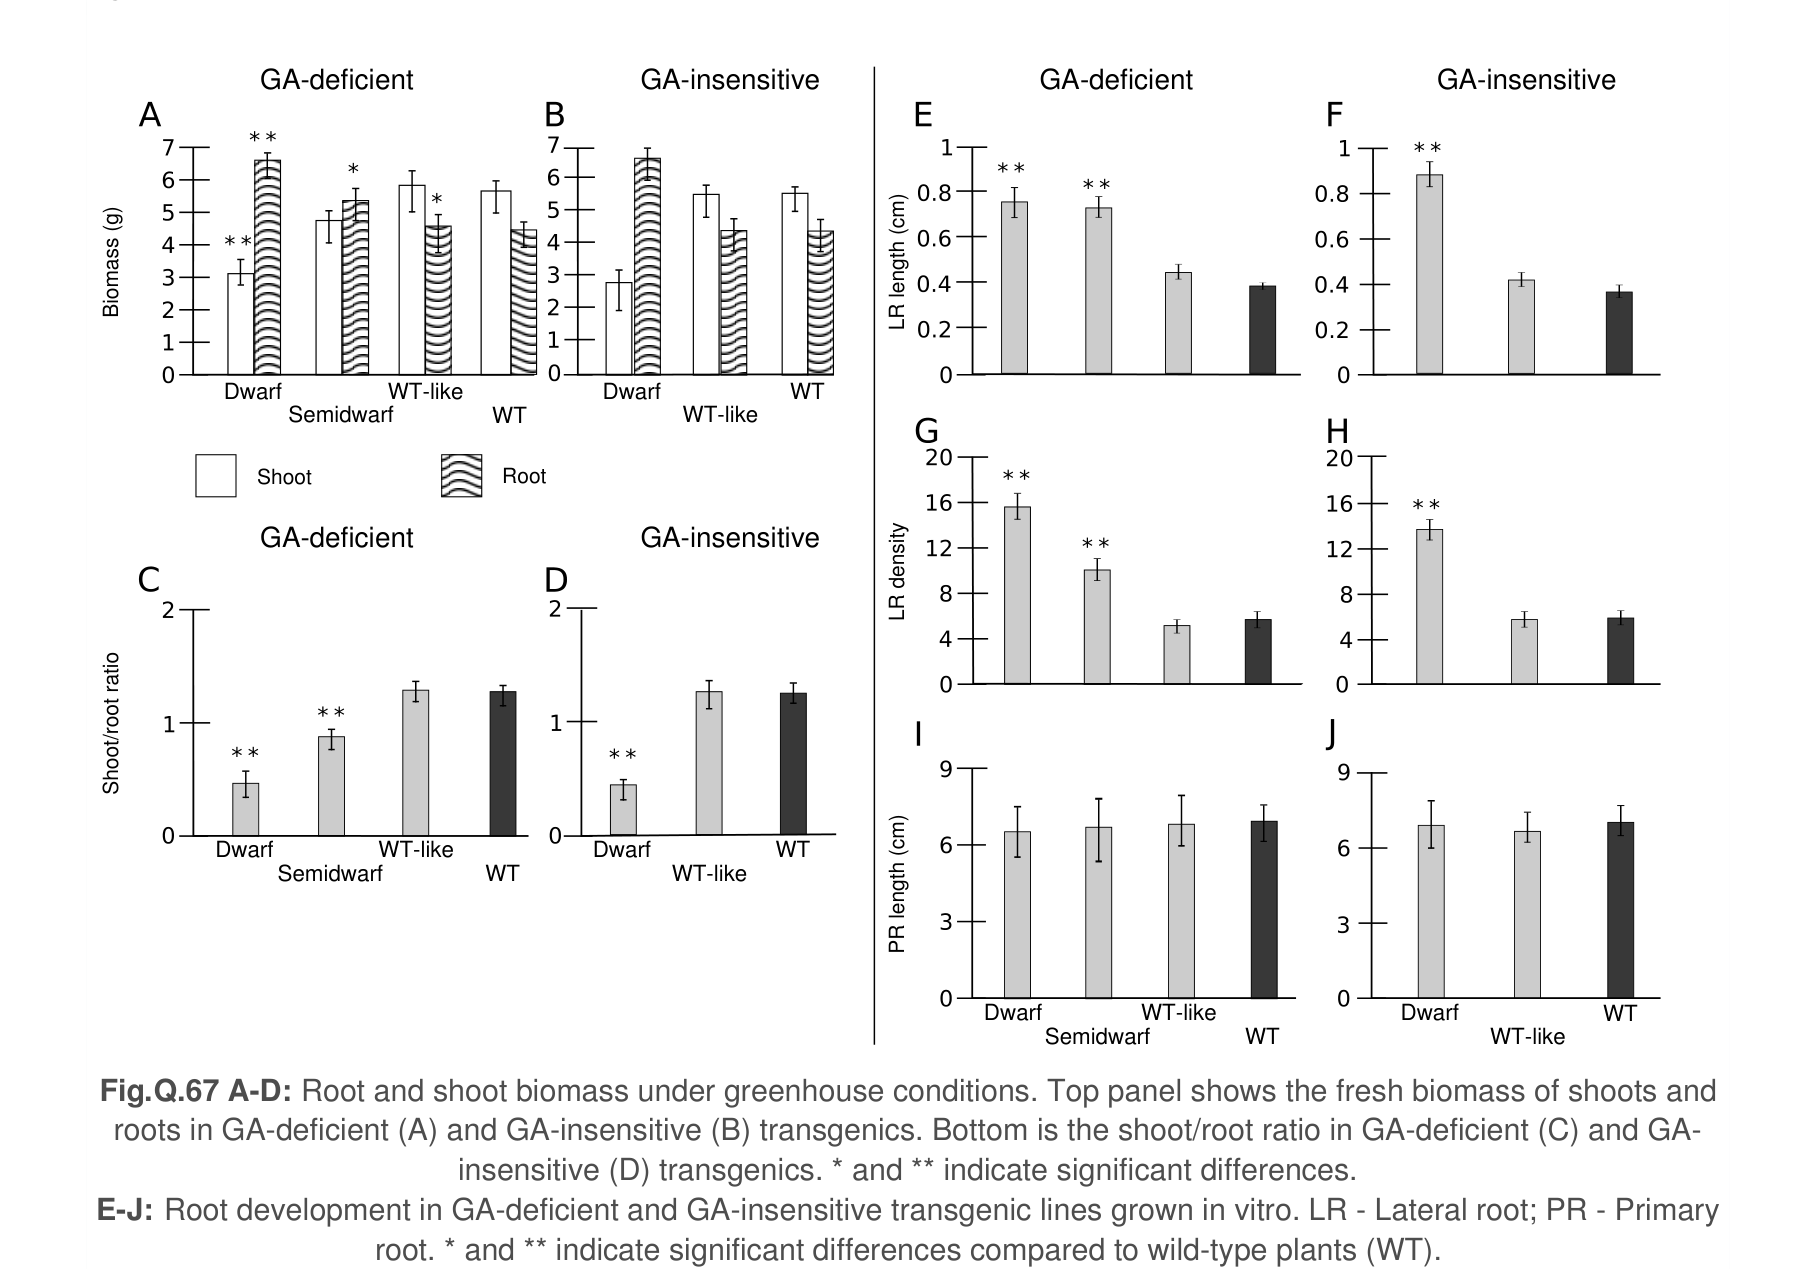 Figure 1.
Using the information and data, determine which of the statements are true or which are false.
Question reproduced from IBO 2016, Theoretical Paper B, licensed under CC BY-NC-SA 4.0 - attributed to the International Biology Olympiad. Open the full exam PDF · Community solutions (unofficial)