To understand the relationship between different factors and tree height, Sequoia sempervirens, one of the tallest known tree species, was studied. Multiple physiological parameters were determined at different heights of multiple individual trees.
Pictures of leaves were taken at different heights (numbers are metres of height of sampling):
Fig.2. Leaf morphology at different sampling heights (m).
Model equations were constructed to predict how different variables influence the maximum height of trees (ψ = leaf water potential; LMA = Leaf Mass:Area ratio; “maximum height”, h, in the equations refers to the maximum height in metres predicted by the equations, values not shown):
Table 1. Col 1 = Dependent value. Col 2 = Equation of max height (h). Col 3 = Limit value of dependent variable.
Q22.1. Sequoia sempervirens (one of the tallest tree species) was studied at different heights, with xylem pressure sampled both before dawn and at midday. How does xylem pressure change with increasing height?
Q22.2. Compare xylem pressure in the topmost leaves before dawn (A) vs. at midday (B).
Q22.3. Epiphytic saplings growing on branches at 95 m show similar leaf structure to leaves of non-epiphytes at just 2 m. What factor is most important in determining leaf structure at a given height?
Q22.4. Table 1 gives model equations predicting how leaf water potential (ψ), Leaf Mass:Area ratio (LMA), δ13C, and photosynthetic rate (Pmax,m) change with tree height h, plus each variable's physiological limit value. ψ = −0.00973h − 0.712, limit = −1.9 MPa. Calculate the maximum height (h, in m) predicted by the ψ equation, i.e. the height at which ψ reaches its limit value.
Q22.5. LMA = 37.43·e^(0.0255h), limit = 833 g·m⁻². Calculate the maximum height predicted by the LMA equation.
Q22.6. δ13C = 0.559·e^(0.0229h) − 31, limit = −20‰. Calculate the maximum height predicted by the δ13C equation.
Q22.7. Pmax,m = −0.434h + 54.3, limit = 0 nmol CO2·g⁻¹·s⁻¹. Calculate the maximum height predicted by the Pmax,m equation.
Q22.8 (Water potential). Based on the four calculated maximum heights (122, 122, 130, 125 m), is water potential (ψ) among the most limiting parameter(s) to tree height?
Q22.8 (LMA). Is Leaf Mass:Area ratio (LMA) among the most limiting parameter(s)?
Q22.8 (δ13C). Is δ13C among the most limiting parameter(s)?
Q22.8 (Pmax,m). Is Pmax,m among the most limiting parameter(s)?
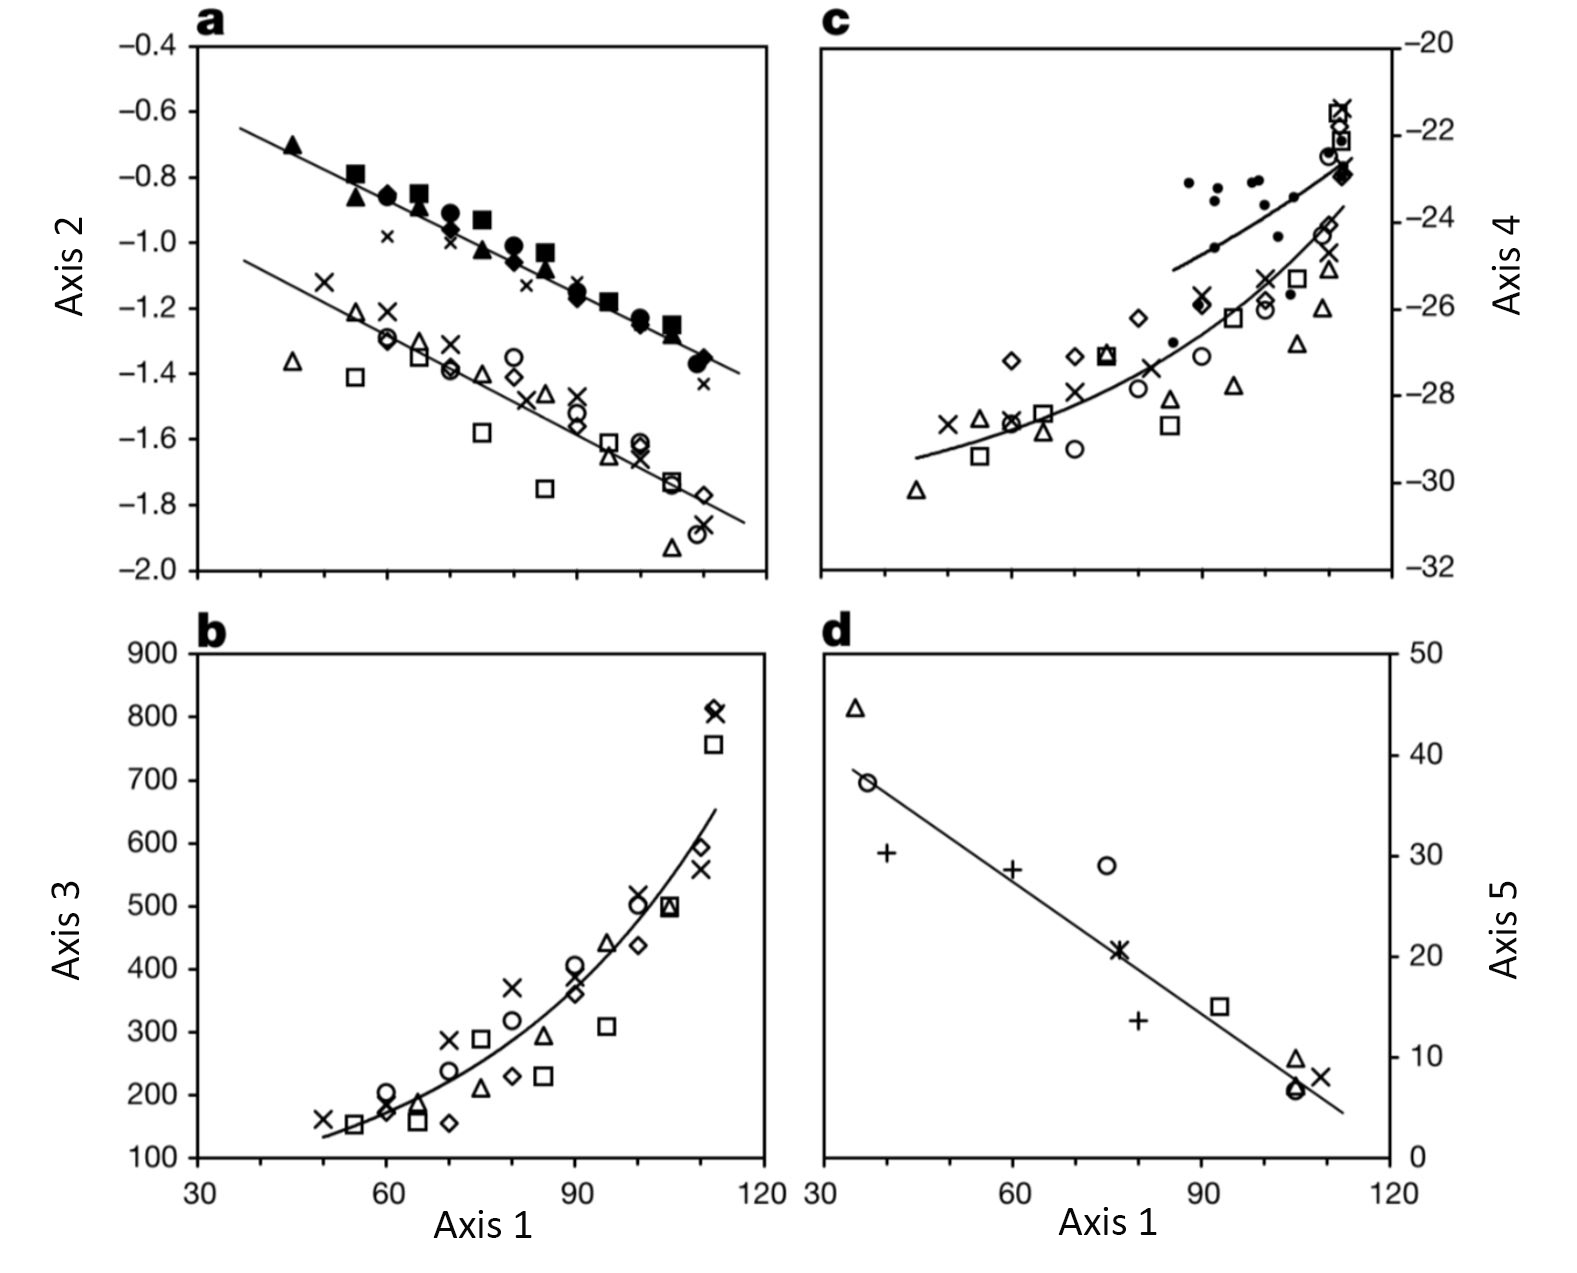 Fig.1. Axis 1 = Height above ground (m). Axis 2 = Xylem pressure (MPa). Axis 3 = Leaf mass:area (g·m⁻²). Axis 4 = Leaf δ13C (‰). Axis 5 = “photosynthetic rate per unit mass” Pmax,m (nmol CO2·g⁻¹·s⁻¹).
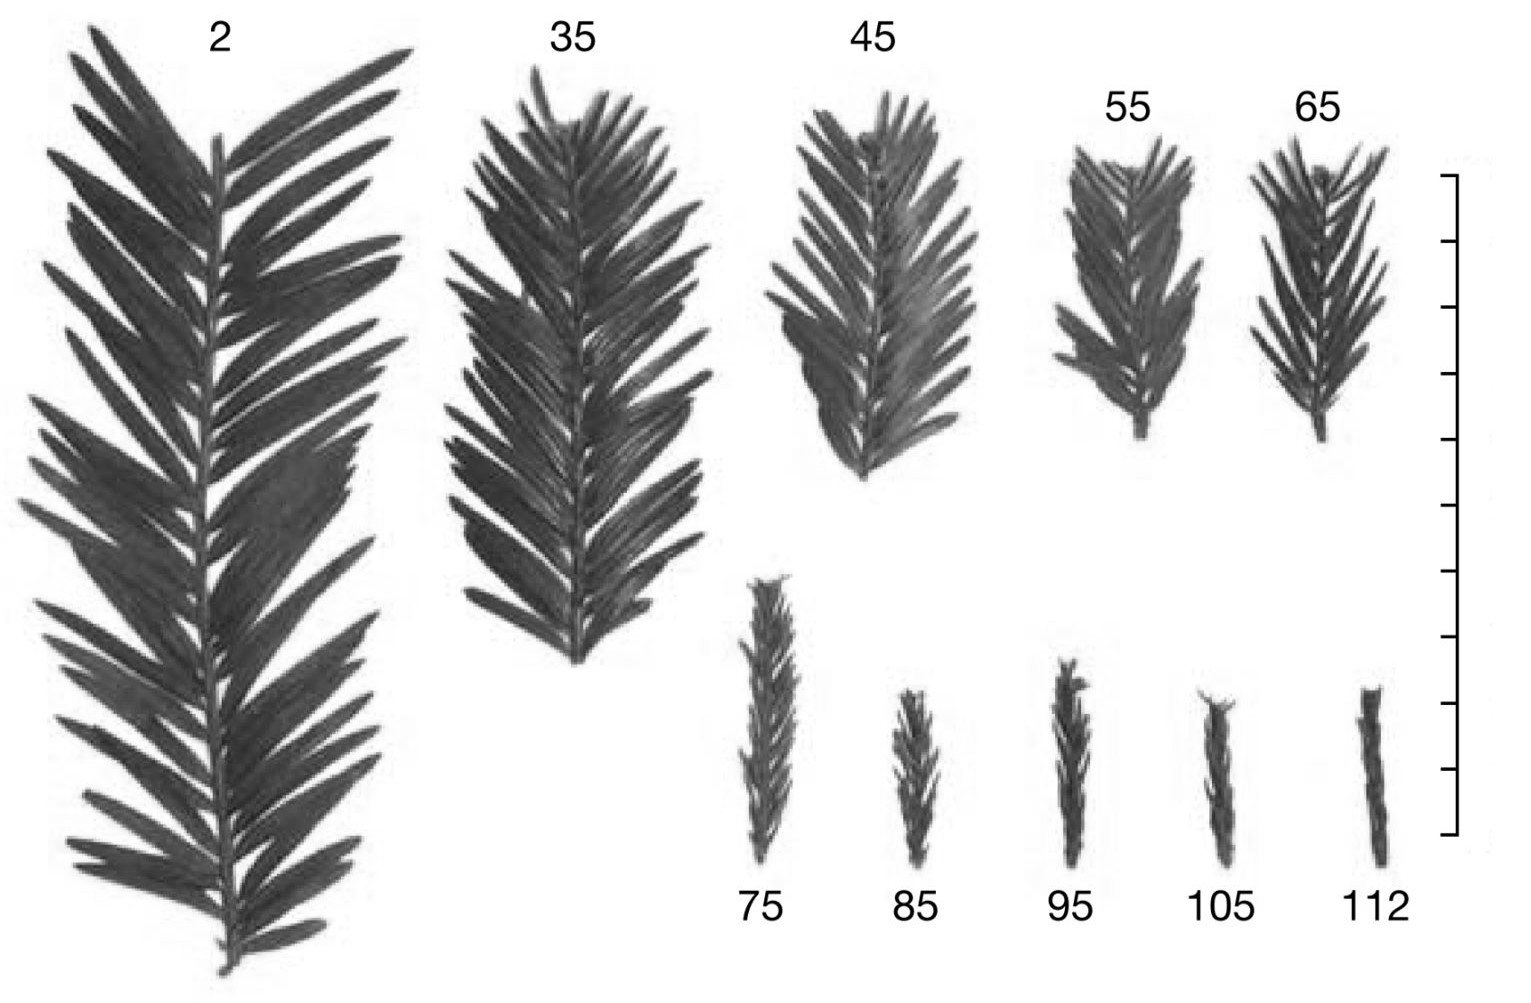 Fig.2. Leaf morphology at different sampling heights (m).
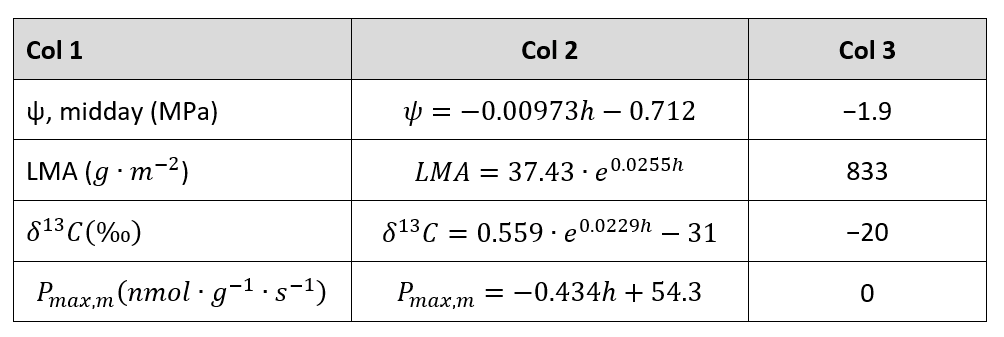 Table 1. Col 1 = Dependent value. Col 2 = Equation of max height (h). Col 3 = Limit value of dependent variable.