Q33 - Tracing Indirect Effects Through a Food Web
The scheme below shows a model of interactions between populations of an ecosystem. Capital letters indicate the populations. Two-ended arrows (↔) indicate whether there is a direct interaction between two populations; the interaction can be beneficial (+), harmful (−), or neutral (0) for each of the populations, marked at the corresponding end of the arrow.
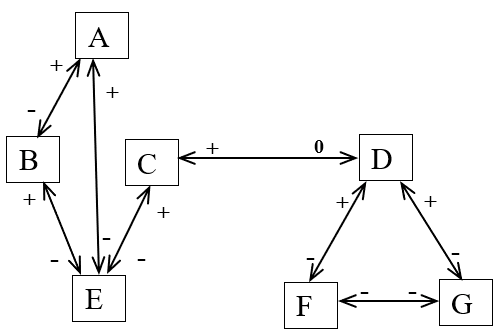 Fig.1.
Determine how the change in size of one population affects (both directly and indirectly) the size of other populations in the ecosystem.
- A: Increase
- B: Not change
- C: Decrease
- D: Cannot be predicted (i.e. the change has both increasing and decreasing effects on the other population)
Q33.1. A diagram shows populations A-G linked by two-ended interaction arrows, each end marked + (benefit), − (harm), or 0 (neutral) for that population. What effect does a DECREASE in population A have on population B?
Q33.2. What effect does a decrease in population A have on population D?
Q33.3. What effect does a decrease in population A have on population E?
Q33.4. What effect does an INCREASE in population D have on population G?
Q33.5. What effect does an increase in population D have on population C?
Q33.6. What effect does an increase in population D have on population A?
Question reproduced from IBO 2019, Theoretical Exam A, licensed under CC BY-NC-SA 4.0 - attributed to the International Biology Olympiad. Open the full exam PDF · Official answer key