Q5 - Meselson–Stahl Experiment - DNA Replication Modes
To find out how DNA replicates, Matthew Meselson and Franklin Stahl performed the following classical experiment. Bacteria were grown in a medium with heavy nitrogen (¹⁵N) until all the DNA was labeled. Then they were grown in a normal nitrogen-containing culture medium (¹⁴N) for 5 generations. The percentage of heavy nitrogen remaining in the DNA was tracked across these 5 generations, under four candidate curves (A–D) representing different hypothetical replication modes.
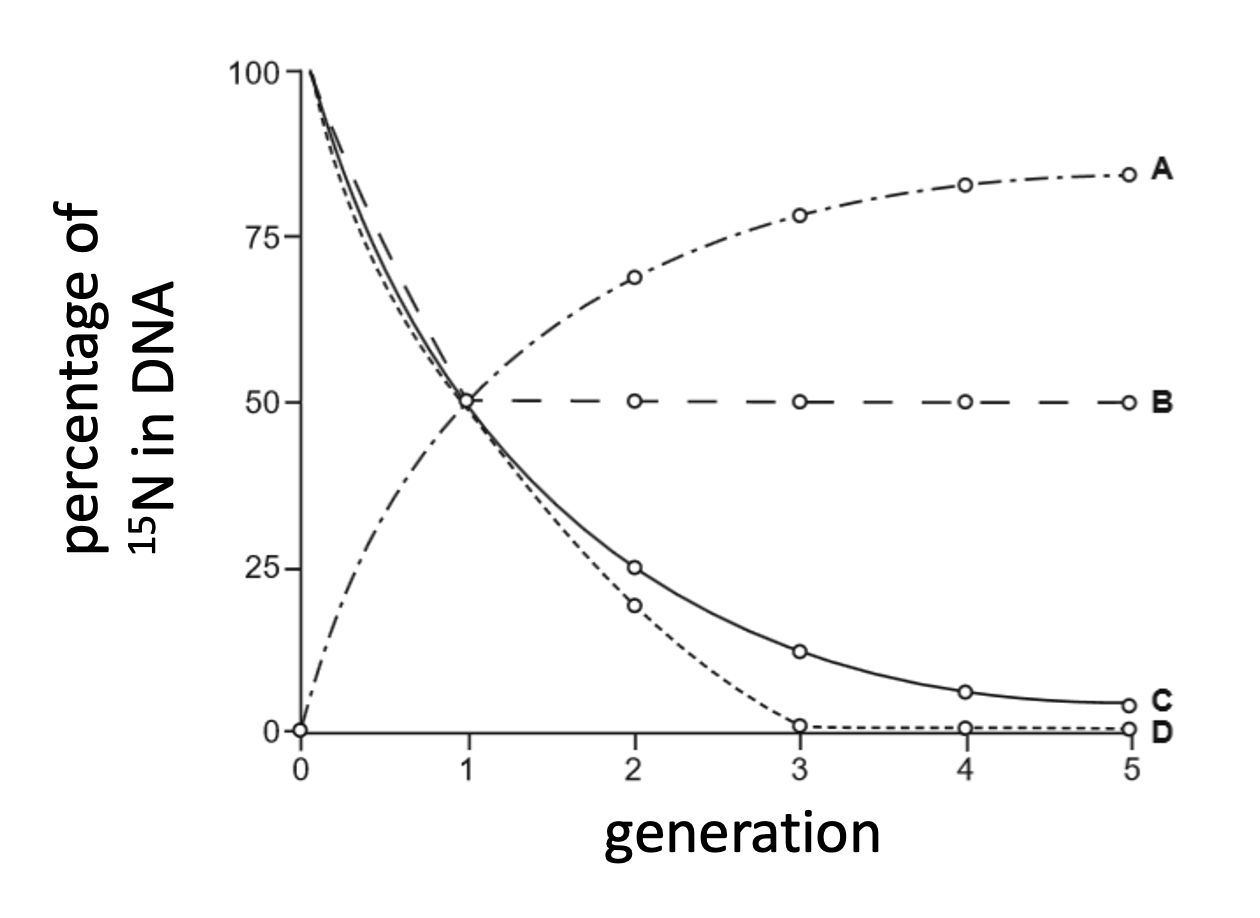 Percentage of ¹⁵N in DNA vs. generation. Curve A rises from 0% toward ~83%. Curve B stays flat at 50% throughout. Curve C starts at 100% and halves each generation, reaching ~3% by generation 5. Curve D starts at 100% and drops to ~0% by generation 3.
Using the information and figure, determine whether the following statements are true or false:
Question reproduced from IBO 2022, Theoretical Paper 1, licensed under CC BY-NC-SA 4.0 - attributed to the International Biology Olympiad. Open the full exam PDF · Community solutions (unofficial)