Q4 - Enzyme Inhibition - Substrate Concentration vs Rate Curves
The following curves show the effect of substrate concentration on the rate of an enzymatic reaction: Section 1/2 trace the reaction with no inhibitor present (a linear rise, section 1, that plateaus at section 2); Section 3 traces the reaction in the presence of inhibitor X; Section 4 traces the reaction in the presence of inhibitor Y.
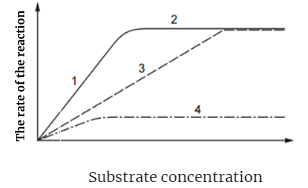 Rate of reaction vs. substrate concentration. Section 1: the linear, substrate-limited rise of the uninhibited reaction. Section 2: where the uninhibited reaction plateaus at Vmax. Section 3 (dashed): the inhibitor-X curve, which converges on the same plateau as sections 1–2 at high substrate concentration. Section 4 (dash-dot): the inhibitor-Y curve, which plateaus lower and never converges with the uninhibited curve.
Choose whether the following statements about Sections 1, 2, 3, and 4 of the enzymatic reactions are true or false:
Question reproduced from IBO 2022, Theoretical Paper 1, licensed under CC BY-NC-SA 4.0 - attributed to the International Biology Olympiad. Open the full exam PDF · Community solutions (unofficial)