Q96 - Transcriptome-Based Drug Repurposing - Infliximab Across Four Diseases
Identifying new applications for approved drugs outside of the scope of their original medical indication is an important strategy in modern pharmaceutics. This strategy is often based on transcriptome analysis. It is assumed that upon administration, the drug causes significant changes in the expression of a particular gene set or sets. These changes characterize the effect of the drug. If the targeted gene set is also associated with a disease (e.g., the gene set is overexpressed during the disease and underexpressed upon drug administration), the studied drug may be a candidate for the disease treatment.
The drug Infliximab’s effect on Crohn’s disease (CD), chronic obstructive pulmonary disease (COPD), sarcoidosis and ulcerative colitis (UC) has been studied using the transcriptome-based approach. Infliximab is an immunosuppressive agent used to treat CD and UC. Gene expression data was obtained from the colonic biopsy samples of CD patients, Infliximab- or placebo-treated UC patients, as well as from lung tissue of COPD and sarcoidosis patients. The results of the analysis are summarized in Figure 1 below. Figure 1A shows the summary heatmap of the transcriptome. Gene sets with the same expression patterns form spots on the heatmap (A, D, etc.). Colors red to blue (from warm to cold) indicate the expression level from upregulation (overexpressed) to downregulation (underexpressed), correspondingly. Figure 1B shows the expression of spots (A, D, etc.) in the test specimens relative to the control (healthy, placebo, or before Infliximab administration). Figure 1C shows quantitative analysis of spot expression profiles.
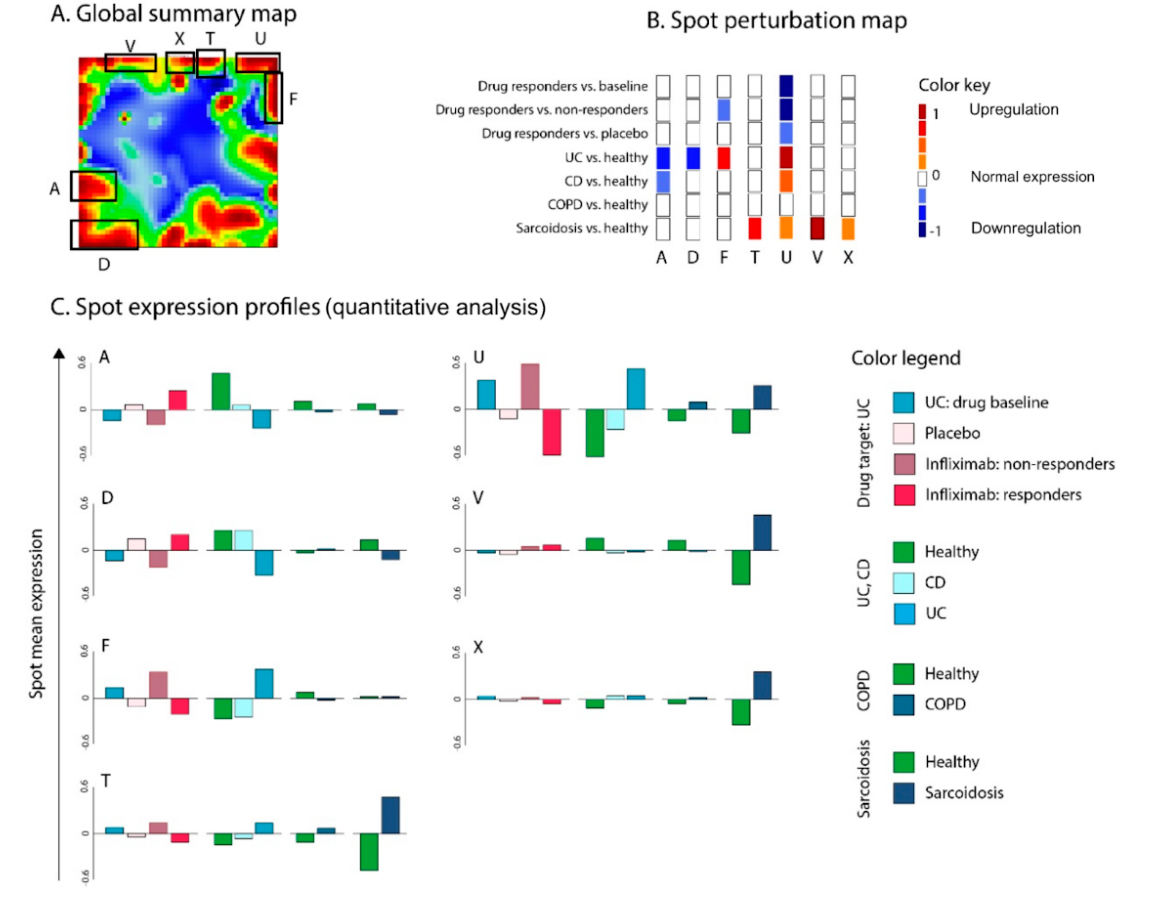 Figure 1. Evaluation of Infliximab’s effect on UC, CD, COPD, and sarcoidosis. (A) Global transcriptome summary heatmap with identified potentially therapeutically relevant gene clusters - spots (A, D, F, T, U, V, X). (B) Drug- and disease-spot perturbation heatmap. (C) Quantitative analysis of spot expression profiles.
Based on these results, determine whether the following statements are true or false.
Question reproduced from IBO 2022, Theoretical Paper 2, licensed under CC BY-NC-SA 4.0 - attributed to the International Biology Olympiad. Open the full exam PDF · Community solutions (unofficial)