Q15 - ENSO and Ecosystem Effects
Walker circulation is the model that describes how temperature differences across the Pacific Ocean can explain local pressure and precipitation: warm, moist air rises and dries out over the Western Pacific, flows east, becomes cold and dry and sinks over the Eastern Pacific, then returns west warming and moistening again.
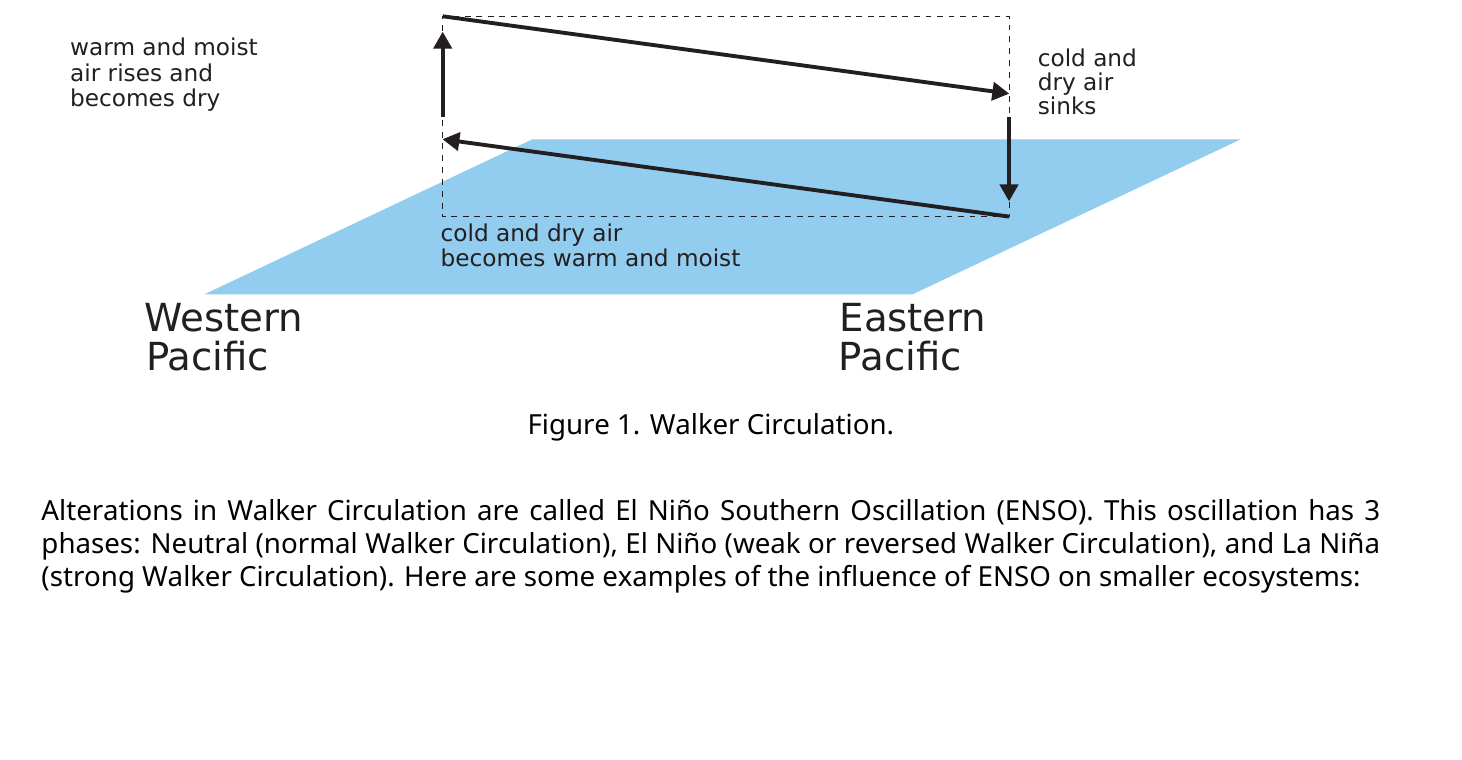 Figure 1. Walker Circulation.
Alterations in Walker Circulation are called El Niño Southern Oscillation (ENSO). This oscillation has 3 phases: Neutral (normal Walker Circulation), El Niño (weak or reversed Walker Circulation), and La Niña (strong Walker Circulation). Here are some examples of the influence of ENSO on smaller ecosystems:
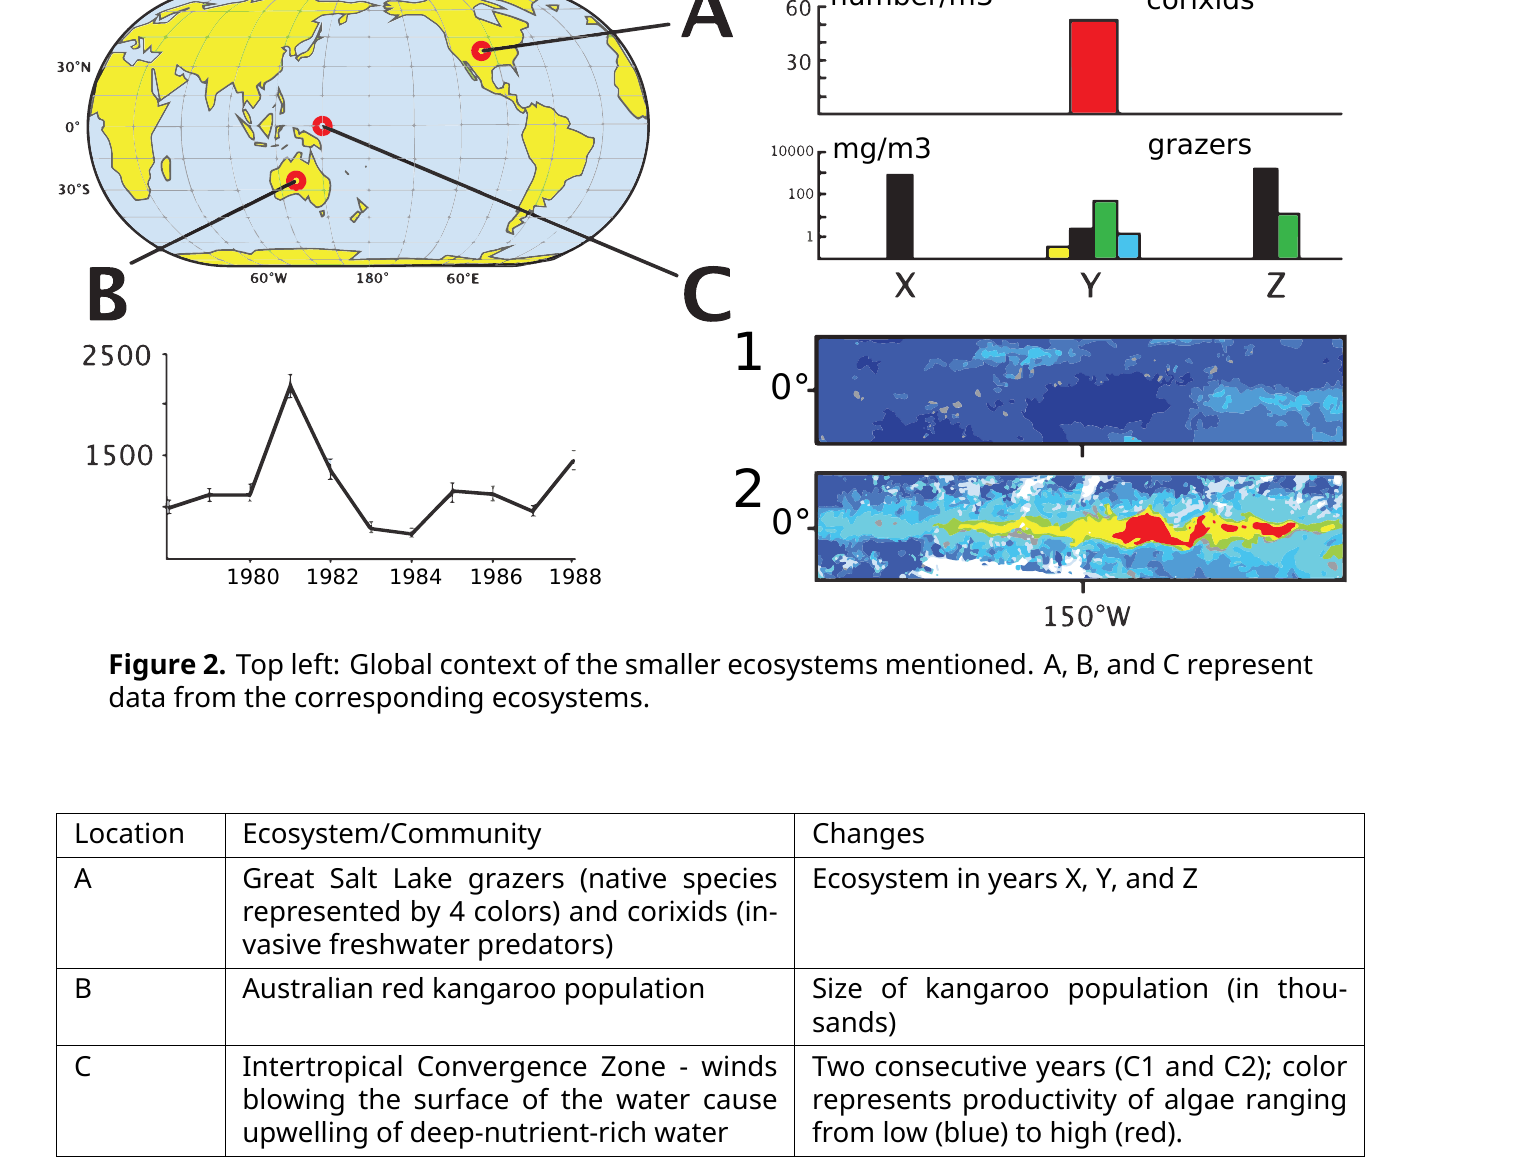 Figure 2. Top left: Global context of the smaller ecosystems mentioned. A, B, and C represent data from the corresponding ecosystems.
| Location | Ecosystem/Community | Changes |
|---|---|---|
| A | Great Salt Lake grazers (native species represented by 4 colors) and corixids (invasive freshwater predators) | Ecosystem in years X, Y, and Z |
| B | Australian red kangaroo population | Size of kangaroo population (in thousands) |
| C | Intertropical Convergence Zone - winds blowing the surface of the water cause upwelling of deep-nutrient-rich water | Two consecutive years (C1 and C2); color represents productivity of algae ranging from low (blue) to high (red). |
On your answer sheet, indicate “T” for true statements and “F” for false ones.
Question reproduced from IBO 2024, Theoretical Exam Part A, licensed under CC BY-NC-SA 4.0 - attributed to the International Biology Olympiad. Open the full exam PDF · Community solutions (unofficial)