Q47 - Cost of Transport in Locomotion
The efficiency of animal locomotion can be expressed in terms of the cost of transport (COT), derived from oxygen consumption versus velocity data. The oxygen consumption plot represents the amount of energy required to achieve and maintain a certain speed. COT represents how efficiently an organism can cover a unit distance at a certain speed, and generally has the same trendline shape among different animals and different gaits of the single animal species.
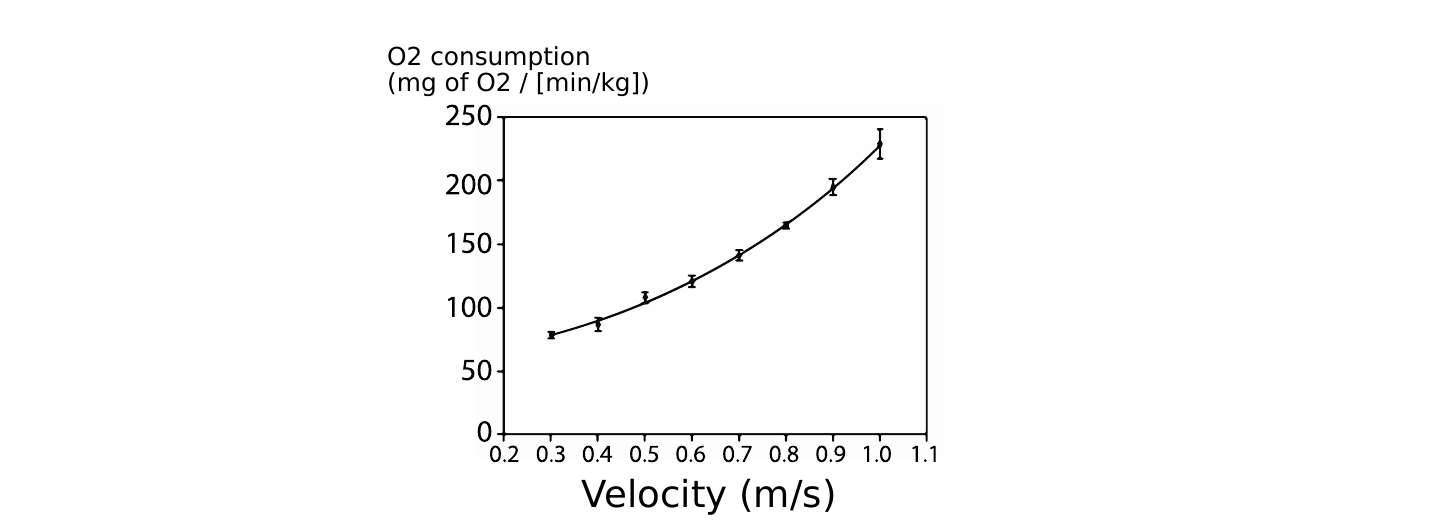 Figure 1. Oxygen consumption versus velocity graph for cod (fish). Table 1. Trendline equation for COT (V is in km/h) and list of coefficients suiting data obtained from cod: COT = a + bV + cV², a = 0.17, b = -0.22, c = 0.14.
On your answer sheet, indicate “T” for true statements and “F” for false ones.
Question reproduced from IBO 2024, Theoretical Exam Part A, licensed under CC BY-NC-SA 4.0 - attributed to the International Biology Olympiad. Open the full exam PDF · Community solutions (unofficial)