Q45 - COPD Lung Volume Changes and Pressure-Volume Curves
Lung volumes can change in Chronic Obstructive Pulmonary Disease (COPD). Figure 1 summarizes normal lung volumes and the changes that occur at different stages of COPD. Figure 1C shows the pressure-volume curve with end-expiratory lung volume (EELV) values for two individuals (1 and 2).
Lung volumes of mild, moderate, and severe COPD patients were studied at rest, at 1/3 maximal power output (Wmax), and at 2/3 Wmax (Figure 2). Graphs T, E, Z do not necessarily correspond to mild, moderate, and severe states in this order.
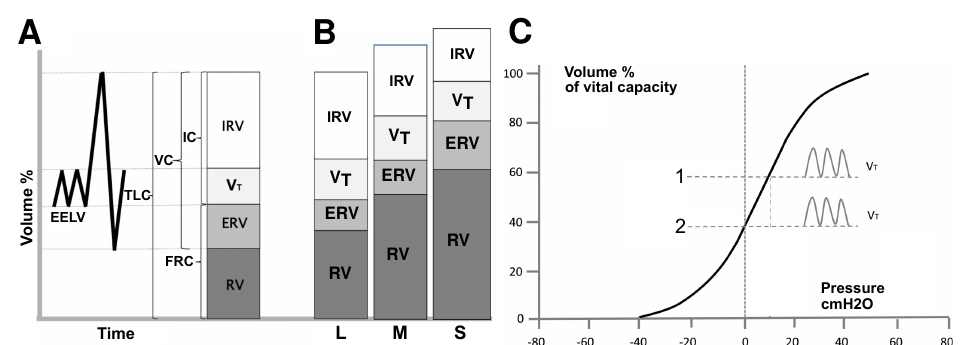 Figure 1. A ERV - expiratory reserve volume; FRC - functional residual capacity; IC - inspiratory capacity; IRV - inspiratory reserve volume; RV - residual volume; TLC - total lung capacity; VC - vital capacity; VT - tidal volume. B Lung volume changes in mild (L), moderate (M), and severe (S) COPD patients. C Pressure-volume curve with end-expiratory lung volume (EELV) for two individuals (1 and 2).
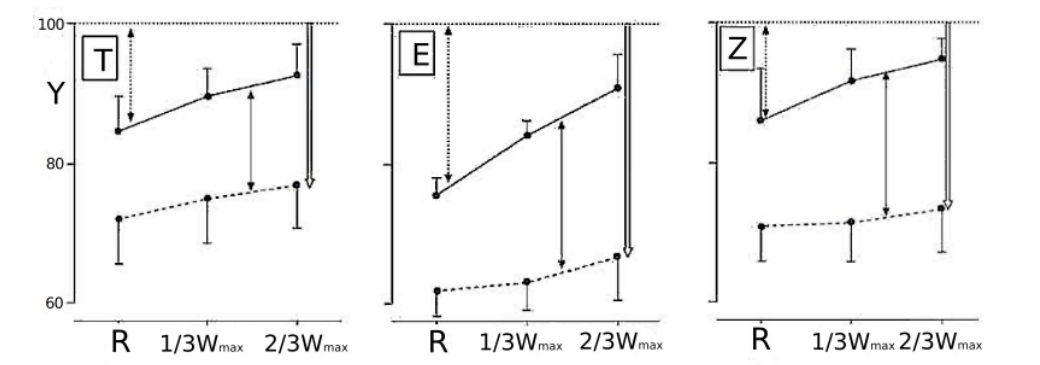 Figure 2. End-expiratory and end-inspiratory volumes at rest (R), 1/3 Wmax, and 2/3 Wmax. Y - volume % of TLC. Panels T, E, and Z represent three COPD severity groups, not necessarily in mild/moderate/severe order.
On your answer sheet, indicate “T” for true statements and “F” for false ones.
Question reproduced from IBO 2024, Theoretical Exam Part B, licensed under CC BY-NC-SA 4.0 - attributed to the International Biology Olympiad. Open the full exam PDF