Q39 - The Leaf Economics Spectrum Across Vascular Plants
During last 500 million years, a great amount of trait variation has been created in land plants in the course of evolution. However, there are some constraints over the possible combinations of traits which indicate evolutionary limitations and trade-offs. To investigate trait combinations in more than 46,000 extant vascular plants, a Principal component analysis was conducted (Diaz et al. 2016). Principal component analysis (PCA) is a statistical procedure converts a set of observations of possibly correlated variables into a set of values of linearly uncorrelated variables called principal components. Figure 1-a shows distribution of investigated vascular plants (including angiosperms, gymnosperms and pteridophytes) in a space conducted by the PCA analysis. Each trait changes along its corresponding axis in this space. Areas with high density of points indicate functional hotspots. There are two major hotspots corresponding to woody and non-woody plants (LA: leaf area, SM: diaspore (fruit or spore) mass, H: plant height, SSD: stem specific density, LMA: leaf mass per area, Nmass: leaf nitrogen content per mass.)
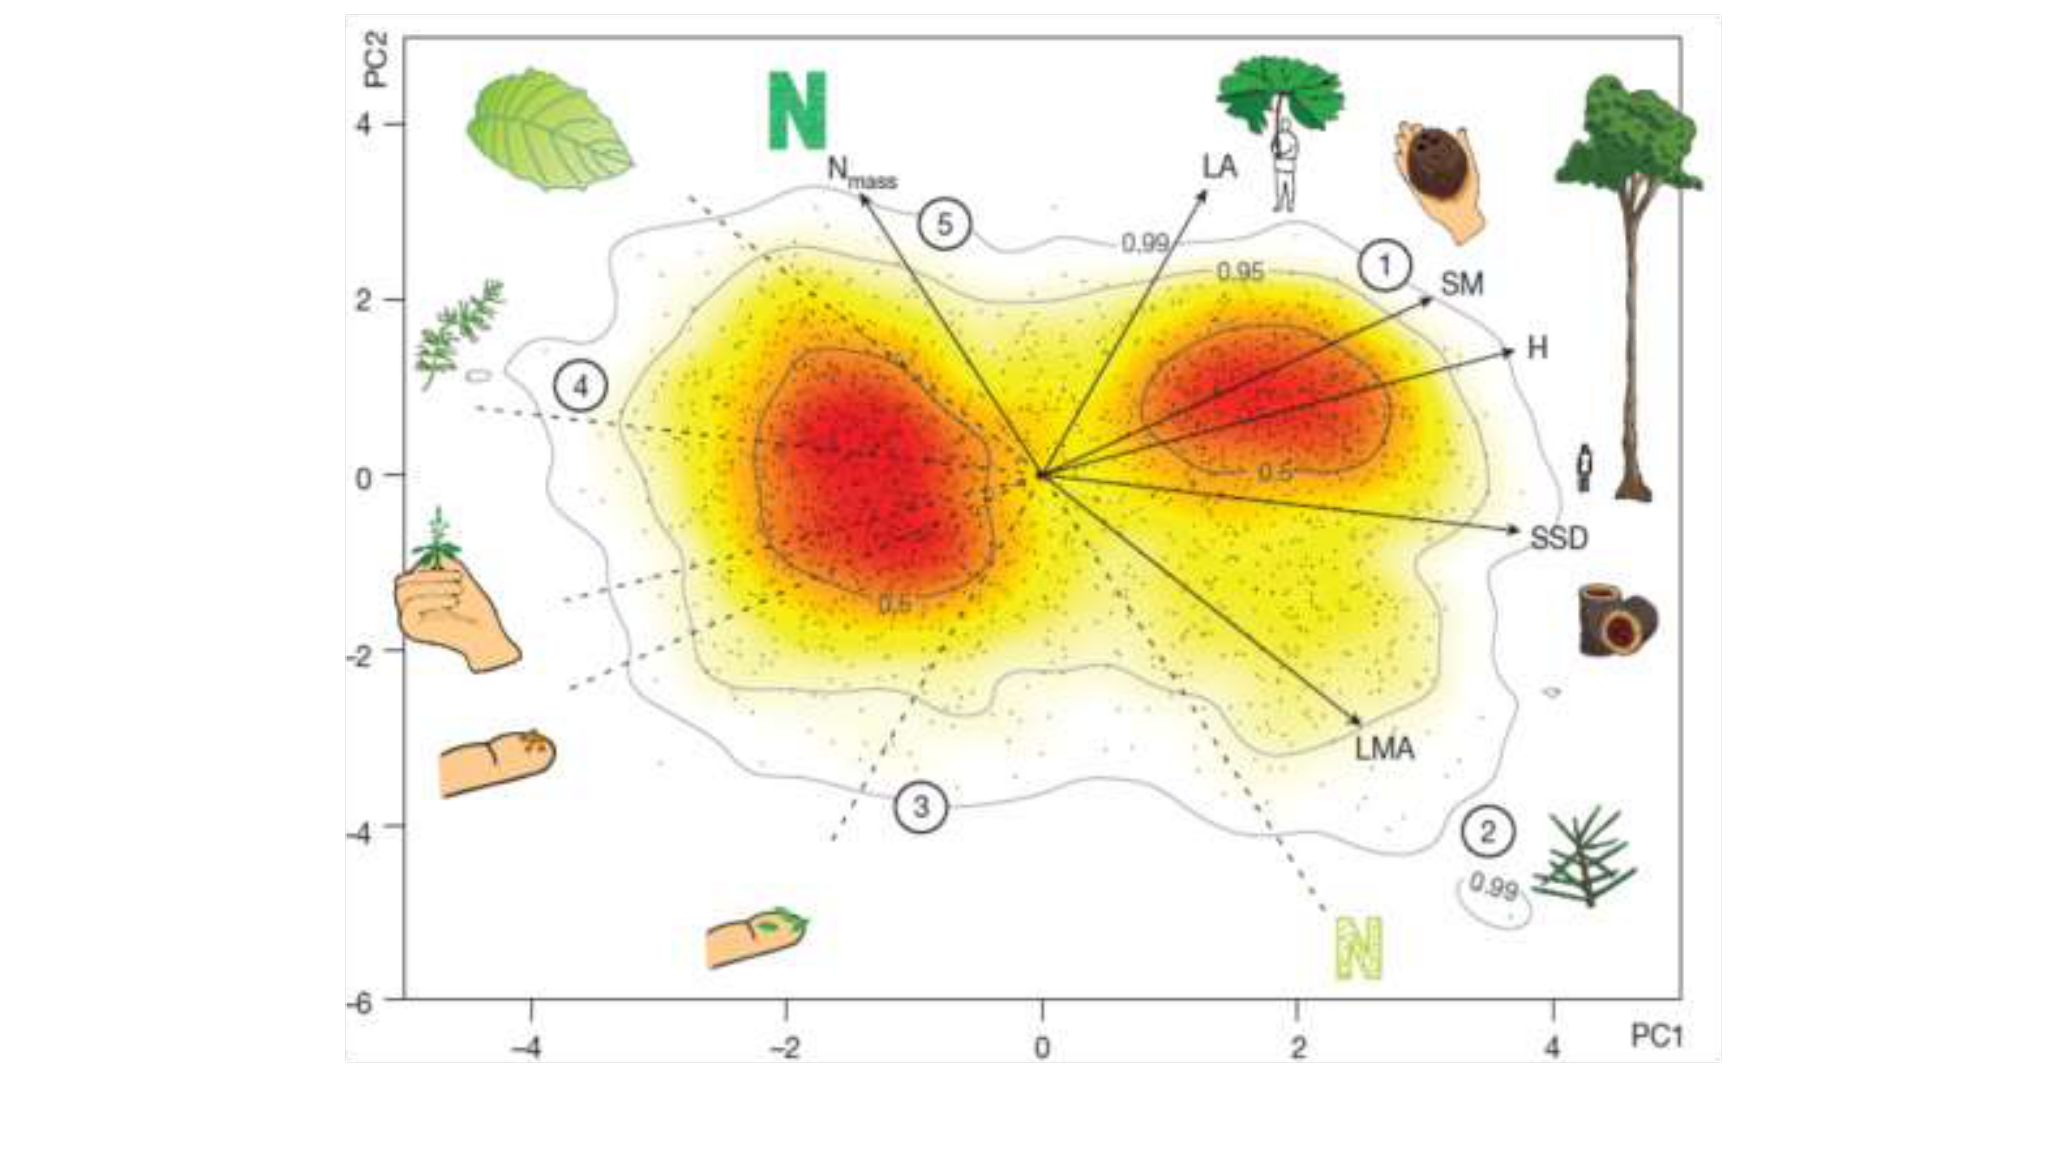 Figure 1.
Using the information and data, determine which of the statements are true or which are false.
Question reproduced from IBO 2018, Theoretical Paper 2, licensed under CC BY-NC-SA 4.0 - attributed to the International Biology Olympiad. Open the full exam PDF · Community solutions (unofficial)