Q2 - Enzyme Kinetics - Time to Completion vs Temperature
Solutions of a specific concentration of enzyme and substrate were mixed to record the rate of the enzymatic reaction. The time required to complete the reaction was measured at various temperatures. The enzyme is completely denatured at 50°C.
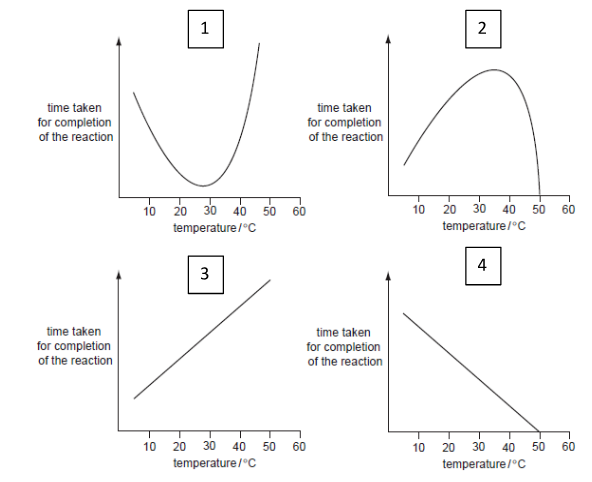 Four candidate graphs of time-taken-for-completion vs. temperature.
For each graph, determine if it represents the results of the experiment correctly (true) or not (false):
A. Graph 1 (U-shaped: high time at low temperature, falling to a minimum around 25-30°C, then rising sharply toward 50°C).
B. Graph 2 (bell-shaped: low time at the extremes, peaking around 30-40°C).
C. Graph 3 (a straight line, time increasing steadily across the whole range).
D. Graph 4 (a straight line, time decreasing steadily all the way to 50°C).
Question reproduced from IBO 2022, Theoretical Paper 1, licensed under CC BY-NC-SA 4.0 - attributed to the International Biology Olympiad. Open the full exam PDF · Community solutions (unofficial)