Q3 - Amylase Activity - Starch Hydrolysis at 50–70°C
The diagram shows experimental data comparing the hydrolysis of starch by amylase at 3 different temperatures.
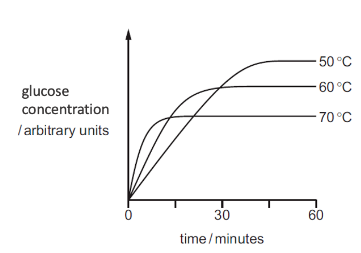 Glucose concentration (arbitrary units) vs. time, for amylase-catalysed starch hydrolysis at 50°C, 60°C, and 70°C. The 50°C curve reaches the highest final glucose level and is still rising at 60 minutes; the 60°C curve plateaus earlier at a lower level; the 70°C curve rises fastest at first but plateaus soonest, at the lowest final level.
What conclusion can be drawn from these data? Determine whether the following statements are true or false:
Question reproduced from IBO 2022, Theoretical Paper 1, licensed under CC BY-NC-SA 4.0 - attributed to the International Biology Olympiad. Open the full exam PDF · Community solutions (unofficial)