Q66 - Transpiration Rate Differences Between Leaf Surfaces
The following diagram demonstrates the impact of light intensity on transpiration rate from the adaxial (upper) and abaxial (lower) surfaces of a eudicot leaf. All other abiotic factors are the same for both conditions. How can we explain the discrepancy in transpiration rates?
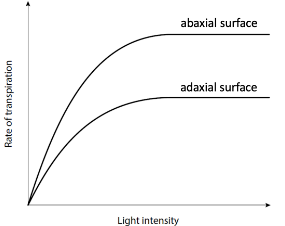 Rate of transpiration from the abaxial and adaxial surfaces of a eudicot leaf as a function of light intensity.
Use the information and figure to determine whether the following statements are true or false.
A. Spongy mesophyll causes faster transpiration because it has more air cavities.
B. Transpiration decreases the water potential in the leaves
C. Transpiration from the upper surface is slower because it has fewer stomata.
D. Air movement would increase transpiration rates from both surfaces.
Question reproduced from IBO 2022, Theoretical Paper 2, licensed under CC BY-NC-SA 4.0 - attributed to the International Biology Olympiad. Open the full exam PDF · Community solutions (unofficial)