Q84 - Dietary Fat, Sucrose and Cardiac Hypertrophy in Hypertensive Rats
Males from inbred lines of rats with spontaneous hypertension (SHR) and normal blood pressure (WKY) were separated into 5 groups and received different diets for 10 weeks. The first group of each line received standard food (SF), groups 2, 3, 4 received SF + a different fatty acid, group 5 received SF+sucrose. In groups 2–5, the added component comprised 11% of the energy value of the SF.
| Line | Diet | Change in body mass (%) | Systolic pressure, 0 week (mmHg) | Systolic pressure, 10 weeks (mmHg) |
|---|---|---|---|---|
| WKY | SF+trans-fat | 14.7 ± 1.3 | 122.2 ± 0.6 | 123.1 ± 0.6 |
| WKY | SF+sucrose | 14.9 ± 2.4 | 123.2 ± 2.0 | 123.6 ± 2.2 |
| SHR | SF | 14.2 ± 2.0 | 121.3 ± 2.1 | 121.9 ± 1.6 |
| SHR | SF+butter | 18.7 ± 1.3 | 122.1 ± 0.9 | 125.6 ± 1.3 |
| SHR | SF+trans-fat | 10.1 ± 0.3 | 200.1 ± 1.8 | 199.9 ± 0.8 |
| SHR | SF+sucrose | 20.6 ± 3.3** | 189.3 ± 3.6 | 190.1 ± 3.9 |
Table 1. Measurements of body mass and blood pressure of the caudal artery were measured at the start and end of the experiments (selected rows; some SF/palm-oil rows in the original are not fully legible in the source scan).
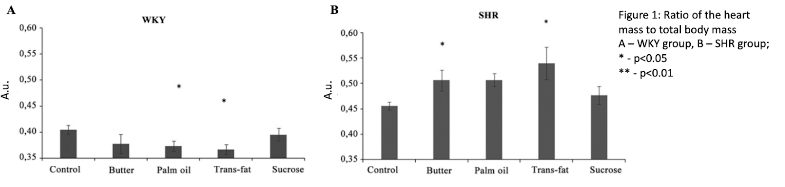 Figure 1. Ratio of the heart mass to total body mass in different dietary regimes. A – WKY group, B – SHR group. * p<0.05, ** p<0.01.
Using the information and the data in the table and figure above, determine which of the statements are true or which are false.
Question reproduced from IBO 2022, Theoretical Paper 2, licensed under CC BY-NC-SA 4.0 - attributed to the International Biology Olympiad. Open the full exam PDF · Community solutions (unofficial)