Q26 - Mass Extinctions and Carbon Cycle Perturbations
Mass extinctions occur when environmental changes outpace rates of species adaptation. One way to quantify this change is by measuring the addition of inorganic carbon to oceans over time. Significant changes in the flux between inorganic and organic carbon reservoirs are termed carbon cycle perturbation events. Mass change measures the magnitude of change in inorganic carbon mass in oceans. Another quantifying metric of a carbon cycle, isotopic shift measures the change in carbon isotopic composition during the event.
In the last 220 million years, the biological pump, which transports organic carbon and calcium carbonate from the ocean’s surface to the deep sea, has significantly strengthened.
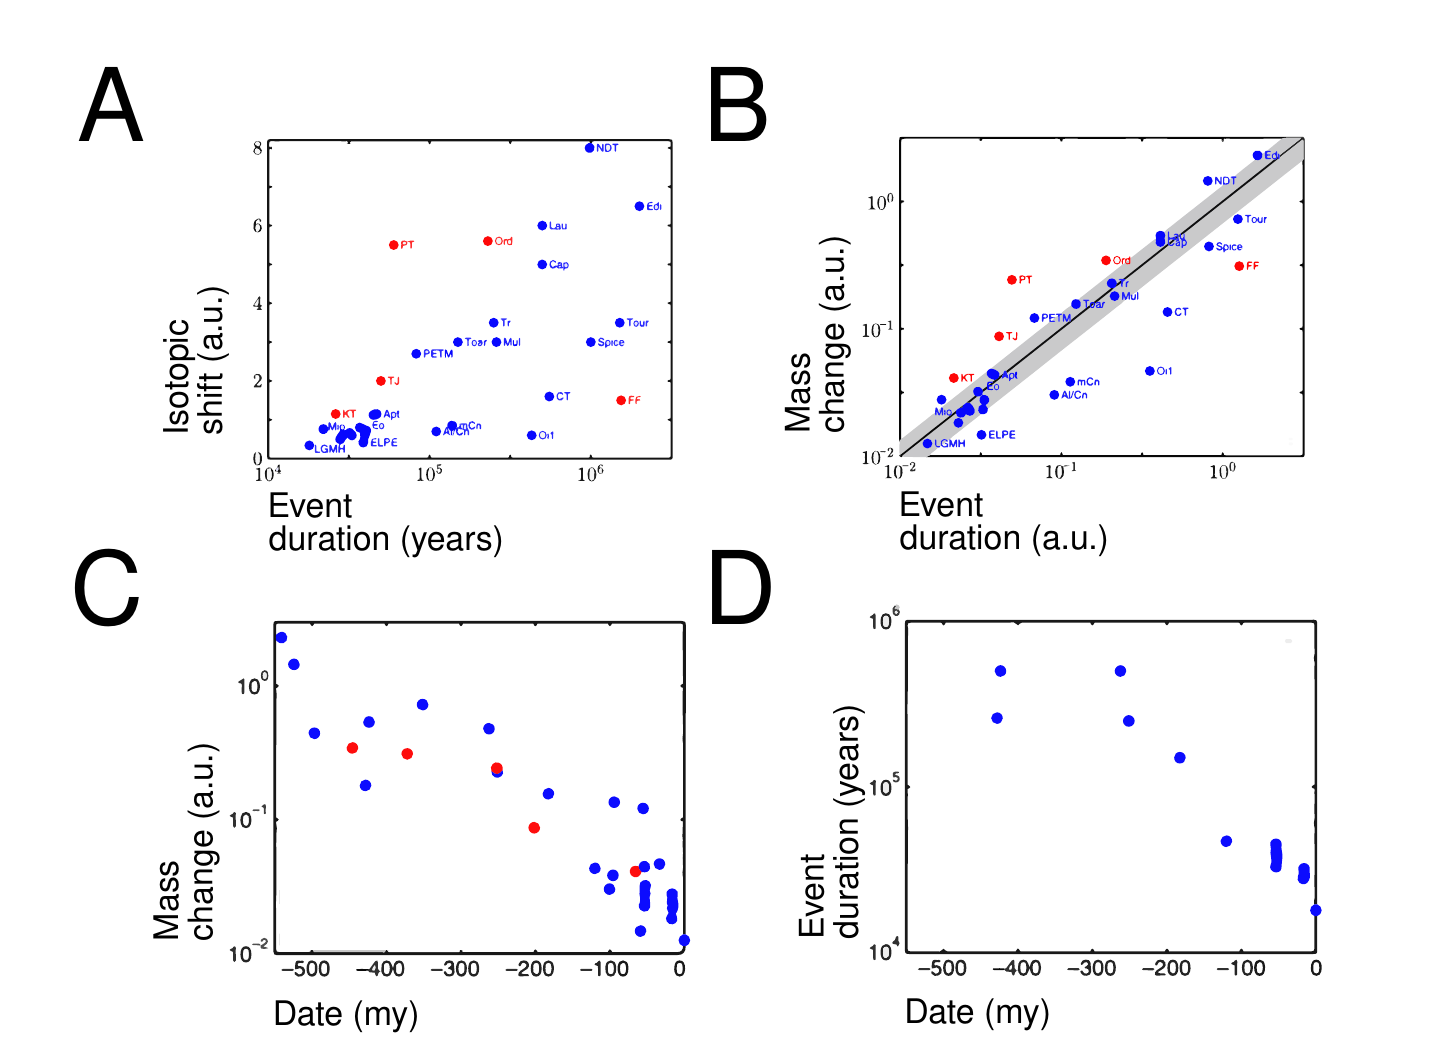 Figure 1. Carbon-shifting processes plots. A Isotopic shift vs Event duration. B Mass change vs Event duration. Gray shaded area around the line represents error margin of the fit line. C Mass change vs Date. D Event duration vs Date; my - million years, a.u. - arbitrary units; Red dots: events considered as mass extinctions. Blue dots: other carbon perturbation events. Units may differ between graphs. Note that mass extinction events are not included in graph D.
On your answer sheet, indicate “T” for true statements and “F” for false ones.
Question reproduced from IBO 2024, Theoretical Exam Part A, licensed under CC BY-NC-SA 4.0 - attributed to the International Biology Olympiad. Open the full exam PDF · Community solutions (unofficial)