Plasma Membrane Structure & Transport
Overview
The plasma membrane is a selectively permeable boundary: its job is not simply to enclose the cell but to control, in a highly specific and regulatable way, exactly what crosses it and in which direction. This page covers the structural model (fluid mosaic) underlying that selectivity, and the distinct physical/energetic logic behind each of the transport mechanisms cells use. The chemistry of the phospholipids and cholesterol described here is covered in full in Lipids & Membrane Biochemistry; this page focuses on the resulting membrane’s functional behaviour.
Key Concepts
The fluid mosaic model
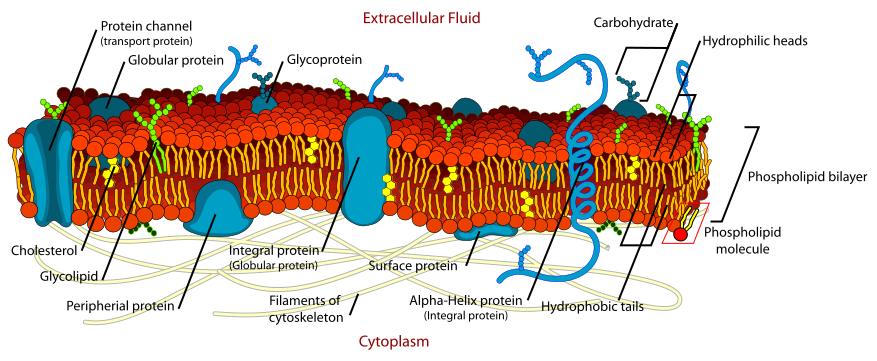
The fluid mosaic model (Singer & Nicolson, 1972) describes the membrane as a two-dimensional fluid in which phospholipids and proteins diffuse laterally, rather than a static, rigid structure. “Fluid” refers to this lateral mobility (phospholipids and many proteins move within their own leaflet); “mosaic” refers to the patchwork arrangement of diverse protein types embedded at varying depths within the lipid bilayer. Fluidity is tuned by fatty acid saturation and cholesterol content (see Lipids & Membrane Biochemistry) and matters functionally: a membrane that is too rigid restricts protein conformational changes (many transport and signalling proteins require this) and vesicle fusion/budding; a membrane that is too fluid compromises barrier integrity.
 Source: en.wikipedia.org (Fluid mosaic model)
Membrane protein topology
Membrane proteins are classified by how they associate with the bilayer:
- Integral membrane proteins span or embed within the hydrophobic core, typically via one or more α-helical transmembrane domains built from hydrophobic residues (matching the bilayer’s hydrophobic interior, see the hydrophobic-effect logic in Protein Structure, Folding & Function). Removing them requires disrupting the bilayer itself (e.g. with a detergent, see Biomolecular Analytical Techniques).
- Peripheral membrane proteins associate with the membrane surface via non-covalent interactions (ionic bonds, hydrogen bonds) with lipid head groups or integral proteins, and can be released by disrupting those interactions alone (e.g. high salt) without dissolving the bilayer.
This structural distinction directly explains the practical extraction-method question addressed in Biomolecular Analytical Techniques: integral proteins require detergent, peripheral proteins can often be released with salt alone.
Simple diffusion
Small, nonpolar, or very small polar molecules (O₂, CO₂, and to a limited extent water itself) can cross the lipid bilayer directly, moving down their concentration gradient with no protein assistance and no energy input: driven purely by random thermal motion and net movement toward equilibrium (entropy increase).
Facilitated diffusion
Larger or charged/polar solutes (glucose, ions) cannot cross the hydrophobic bilayer core directly and require a membrane transport protein, but still move down their concentration gradient and require no direct energy input: the protein simply provides a lower-energy path across the membrane. Two structural strategies:
- Channel proteins form a continuous aqueous pore (e.g. ion channels, aquaporins for water), generally faster than carriers, since no conformational cycling is required per molecule transported, but less able to couple transport to any other process.
- Carrier proteins bind the solute, undergo a conformational change, and release it on the other side: slower per molecule than a channel, but this binding step is exactly what allows carriers to be coupled to secondary active transport (below).
Active transport: primary and secondary
Active transport moves solutes against their concentration gradient, which is thermodynamically unfavourable and therefore requires an energy input.
- Primary active transport couples transport directly to a chemical energy source, almost always ATP hydrolysis (e.g. the Na⁺/K⁺-ATPase, which pumps 3 Na⁺ out and 2 K⁺ in per ATP hydrolysed, maintaining the steep Na⁺/K⁺ gradients essential for nerve/muscle excitability and, indirectly, for secondary active transport below).
- Secondary active transport (cotransport) does not use ATP directly. Instead, it harnesses the electrochemical gradient of one solute (typically Na⁺, built up by a primary active transporter like the Na⁺/K⁺-ATPase) to drive a second solute against its own gradient, via a shared carrier protein. Two geometries: symport (both solutes move in the same direction, e.g. the intestinal Na⁺/glucose symporter, SGLT) and antiport (solutes move in opposite directions, e.g. the Na⁺/Ca²⁺ exchanger). The energetic logic: allowing Na⁺ to run back down its steep, ATP-built gradient releases enough free energy to pull the second solute uphill against its own gradient: the ATP cost was “spent” upstream, at the primary pump, not at the cotransporter itself.


Osmosis: water’s special case
Osmosis is the diffusion of water across a selectively permeable membrane, down water’s own concentration gradient, which, practically, means water moves toward the side with higher solute concentration (lower water concentration). A cell in a hypertonic solution (higher external solute concentration) loses water and shrinks (crenation in animal cells, plasmolysis in plant cells); in a hypotonic solution, it gains water and swells (potentially lysing, in animal cells lacking a cell wall, plant cells instead build up turgor pressure against their cell wall, which is central to structural support in Plant Anatomy and stomatal function in Plant Physiology). Aquaporins are channel proteins that greatly accelerate osmotic water flow without altering its thermodynamic direction.

Comparative Structures
| Mechanism | Direction relative to gradient | Requires protein? | Requires direct energy input? | Example |
|---|---|---|---|---|
| Simple diffusion | Down | No | No | O₂, CO₂ crossing the bilayer |
| Facilitated diffusion (channel) | Down | Yes | No | Ion channels, aquaporins |
| Facilitated diffusion (carrier) | Down | Yes | No | GLUT glucose transporters |
| Primary active transport | Up (against) | Yes | Yes (direct, e.g. ATP) | Na⁺/K⁺-ATPase |
| Secondary active transport | Up (against, for the cotransported solute) | Yes | Indirect (uses a gradient built by primary transport) | Na⁺/glucose symporter |
| Osmosis | Down (water’s own gradient) | Optional (aquaporins accelerate but aren’t required) | No | Water movement toward hypertonic side |
Common Exam Questions
- “Is this process active or passive?”: the single reliable test is whether the net movement is with or against the solute’s own concentration gradient, not whether a protein is involved (facilitated diffusion uses a protein but is still passive).
- “Why is secondary active transport considered active if it doesn’t use ATP directly?”, because the transported solute itself still moves against its own gradient; the energy source (an existing electrochemical gradient) was built by ATP-dependent primary transport upstream, but is still ultimately ATP-derived.
- Tonicity questions (hypertonic/hypotonic/isotonic) frequently combine with plant vs. animal cell context: know that plant cells resist lysis in hypotonic solutions via the cell wall (developing turgor pressure) where an equivalent animal cell would lyse.
Visual Reference
Interactive
- A membrane transport simulator: a concentration-gradient slider across a schematic membrane, with a mode toggle between simple diffusion, facilitated diffusion, and active transport (ATP-cost indicator shown for active transport only), animating solute movement direction and rate under each mode.
Static
(Static images are placed inline in Key Concepts above, next to the concept each one illustrates, rather than collected here. Note: the fluid mosaic model image could not be fully visually verified, see the inline note.)
Practice Challenge
Competition-sourced practice questions for this topic, graded by difficulty. Click the Solution tab to reveal each answer.
0.3 M sucrose and 0.3 M glycerol both show osmotic potential same as that found within a human erythrocyte. If RBCs are suspended in these solutions independently for about an hour, cells suspended in glycerol solution show haemolysis. Which of the following can be best deduced from this?
A. Glycerol is more hydrophilic than sucrose.
B. Water from the glycerol solution enters the cells leaving a hypertonic solution of glycerol outside. C. Glycerol has greater cell membrane permeability than sucrose.
D. Sucrose being a disaccharide requires a specific carrier protein to pass through the erythrocyte membrane.
A student was studying transport of a solute ‘X’ through the erythrocyte membrane in a laboratory. She obtained the following data:
| Experiment | [X] outside (mM) | Rate of Entry of X (μmoles/min) |
|---|---|---|
| I | 0 | 0 |
| II | 0.5 | 7 |
| III | 1.0 | 14 |
| IV | 2.0 | 26 |
| V | 3.0 | 35 |
| VI | 5.0 | 38 |
Which of the following can be deduced from the observations? A. The experiments I: VI were carried out at successively increasing temperatures.
B. The nature of solute must be highly non-polar.
C. Increase of solute concentration outside has resulted in proportional increase in rate of entry of the solute into the cell. D. The major limiting factor for the rate of entry is the carrier protein transporter.
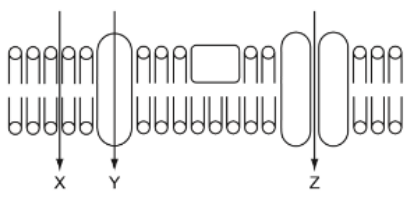
There are 3 arrows in the figure: X, Y, Z that show paths of movement of substances through the cell surface membrane. Using the figure, determine whether the following statements are true or false:A. Vitamin D can be transported through X.
B. Sodium and potassium ions can be transported through X.
C. Large native globular proteins can be transported through Y.
D. Water can be transported through Z
The neurotransmitter acetylcholine is made in the cytosol and then transported into synaptic vesicles, where its concentration is more than 100-fold higher than in the cytosol. When synaptic vesicles are isolated from neurons, they can take up additional acetylcholine added to the solution in which they are suspended, but only when ATP is present. Na+ ions 3 are not required for acetylcholine uptake, but, curiously, raising the pH of the solution in which the synaptic vesicles are suspended increases the rate of acetylcholine uptake. Furthermore, transport is inhibited when drugs are added that make the membrane permeable to H+ ions. Which of the following set of statements are consistent with the observation?i. Acetylcholine is being transported into the vesicle by H+ -acetylcholine antiport system.ii. H + gradient that drives the uptake is generated by an ATP driven H+ pump.iii. Raising the pH of the solution surrounding the vesicles increases the H+ gradient.iv. Transport of acetylcholine into the vesicle is a secondary active transport process.
A. i, ii and iii onlyB. ii and iv onlyC. i, ii and iv only D. i, ii, iii and iv
Two biomolecules (P and Q) which can act as carbon sources were added to a bacterial culture. When their initial rates of entries into the bacterial cell were measured, the following data was obtained.
| Carbon Source (mM) | Initial Rate of Transport (µmoles/min) | |
|---|---|---|
| P | Q | |
| 0.1 | 2 | 18 |
| 0.3 | 6 | 46 |
| 1.0 | 20 | 100 |
| 3.0 | 60 | 150 |
| 10.0 | 200 | 162 |
(I) What can be deduced from the data? A. P is transported by a channel protein while Q is transported by a carrier protein.
B. P is transported by a carrier protein while Q is transported by passive diffusion.
C. Both P and Q are transported by active transport.
D. Both P and Q are transported by carrier proteins.
(II) Which of the following can be correlated with the above deduction? Put a tick mark (√) in the appropriate box in the table. A. P: charged molecule Q: uncharged molecule.
B. P: polar molecule Q: non-polar molecule.
C. P and Q: both uncharged but Q is smaller than P.
D. P and Q: both uncharged molecules but P is smaller than Q.
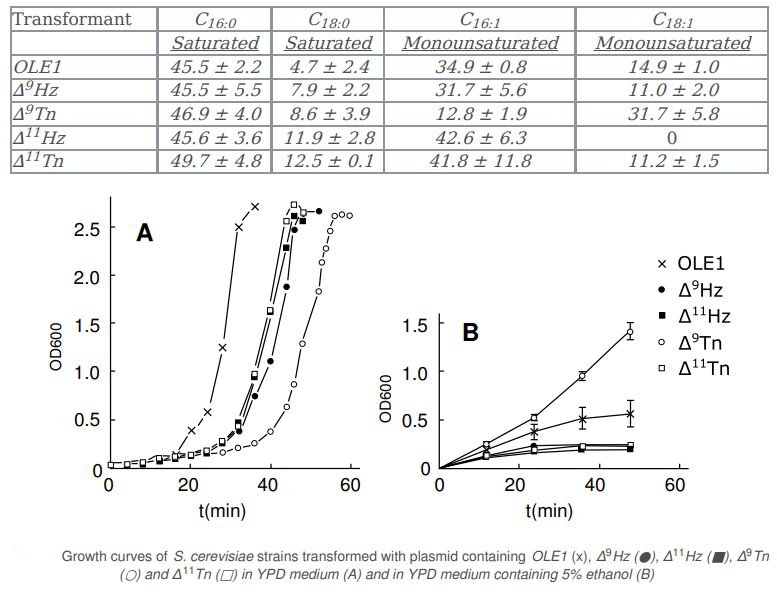
Ethanol inhibits microbial growth. Nevertheless, some strains of the yeast Saccharomyces cerevisiae can adapt to high concentrations of ethanol. Many studies have documented the alteration of cellular lipid composition in response to ethanol exposure. In this investigation, we systematically altered the fatty acid composition in S. cerevisiae by knocking out OLE1 gene coding for integral membrane desaturase, responsible for the formation of monosaturated palmitoleic acid (∆9-C16:1) and oleic acid (∆9-C18:1). The knockout strain was then: (1) reconstituted with OLE1 gene by transformation with YEpOLE1 plasmid; (2) transformed with YEp-∆9Hz, YEp-∆9Tn, YEp-∆11Hz or YEp-∆11Tn plasmid containing ∆9 or ∆11 desaturases of two lepidopteran insect (moths) Helicoverpa zea (Hz) or Trichoplusia ni (Tni). Fatty acid component and growth curves of each transformant were investigated and shown in table and figure below:
Indicate if each of the following statements is True or False.
A. The lag phase of transformant OLE1 in YPD medium is shorter than those of ∆ 9Hz, ∆9Tn, ∆11Hz and ∆11Tn due to the presence of native desaturase in yeast cells.
B. Desaturases are equally active in all transformants.
C. The content of mono-unsaturated fatty acids is a good indicator of the ethanol tolerance in S. cerevisiae.
D. Higher ratio of ∆ 9-C18:1 to ∆9-C16:1 causes higher ethanol tolerance in S. cerevisiae.
Practice Problems
1. A cell’s Na⁺/K⁺-ATPase is pharmacologically inhibited (e.g. by ouabain). Predict the immediate effect on glucose uptake via the Na⁺/glucose symporter, even though the symporter itself is not directly targeted by the drug, and explain the causal chain.
Show answer
Glucose uptake via the symporter falls. The Na⁺/glucose symporter is a secondary active transporter, its ability to pull glucose uphill depends entirely on the steep inward Na⁺ gradient maintained by the Na⁺/K⁺-ATPase. Inhibiting the pump allows the Na⁺ gradient to run down (as Na⁺ leaks back in via other paths without being pumped back out), progressively removing the driving force the symporter depends on, even though the symporter protein itself is structurally and catalytically unaffected by the drug.
2. A red blood cell (no cell wall) is placed in a hypotonic solution. Predict its fate, and contrast this with what would happen to a plant cell placed in the same solution.
3. Explain why a channel protein generally achieves a higher transport rate (molecules/second) than a carrier protein for the same solute concentration gradient, in terms of the mechanistic difference between the two protein types.